【Nightingale (夜莺)监控系统安装配置】
Nightingale (夜莺)监控系统安装配置文章目录Nightingale (夜莺)监控系统安装配置前言一、安装版本及部署环境二、前置项目安装配置脚本1.Prometheus-2.28.0.linux-amd64.tar.gz、Mariadb、Redis安装配置2.安装注意事项三、服务项目安装配置四、后置Agent服务1.linux版本安装配置2.windows版本安装配置五、安装完成前端展示
Nightingale (夜莺)监控系统安装配置
文章目录
前言
夜莺( Nightingale )是一款国产开源、云原生监控系统,Nightingale 在 2020.3.20 发布 v1 版本,目前是 v5 版本,从这个版本开始,与 Prometheus、VictoriaMetrics、Grafana、Telegraf、Datadog 等生态做了协同集成,力争打造国内最好用的开源运维监控系统。出自 Open-Falcon 研发团队
一、安装版本及部署环境
操作系统:Centos7.9
前置项目:Prometheus-2.28.0.linux-amd64.tar.gz、Mariadb、Redis
项目版本:n9e-5.6.2.tar.gz、n9e-fe-5.2.1.tar.gz
后置Agent(使用telegraf)版本:
- linux:1.20.4
- windows:1.20.4(测试用1.2.1无法正常获取端口监测数据)
二、前置项目安装配置脚本
1.Prometheus-2.28.0.linux-amd64.tar.gz、Mariadb、Redis安装配置
代码如下(示例):
# install prometheus
mkdir -p /opt/prometheus
wget https://s3-gz01.didistatic.com/n9e-pub/prome/prometheus-2.28.0.linux-amd64.tar.gz -O prometheus-2.28.0.linux-amd64.tar.gz
tar xf prometheus-2.28.0.linux-amd64.tar.gz
cp -far prometheus-2.28.0.linux-amd64/*  /opt/prometheus/

# service
cat <<EOF >/etc/systemd/system/prometheus.service
[Unit]
Description="prometheus"
Documentation=https://prometheus.io/
After=network.target

[Service]
Type=simple

ExecStart=/opt/prometheus/prometheus  --config.file=/opt/prometheus/prometheus.yml --storage.tsdb.path=/opt/prometheus/data --web.enable-lifecycle --enable-feature=remote-write-receiver --query.lookback-delta=2m

Restart=on-failure
SuccessExitStatus=0
LimitNOFILE=65536
StandardOutput=syslog
StandardError=syslog
SyslogIdentifier=prometheus


[Install]
WantedBy=multi-user.target
EOF

systemctl daemon-reload
systemctl enable prometheus
systemctl restart prometheus
systemctl status prometheus

# install mysql
yum -y install mariadb*
systemctl enable mariadb
systemctl restart mariadb
mysql -e "SET PASSWORD FOR 'root'@'localhost' = PASSWORD('1234');"

# install redis
yum install -y redis
systemctl enable redis
systemctl restart redis
2.安装注意事项
- 服务器环境需要联网,配置好yum源。
- Redis使用yum安装时,需要配置epel-release源(yum install epel-release),不然无法直接通过yum安装Redis。
- 注意MySQL安装时配置了密码为1234,建议维持不变,后续就省去了修改配置文件的麻烦。
三、服务项目安装配置
代码如下(示例):
mkdir -p /opt/n9e && cd /opt/n9e

# 去 https://github.com/didi/nightingale/releases 找最新版本的包,文档里的包地址可能已经不是最新的了,目前下载后端包里面自带的前端包pub是5.2.0,需要单独下载:https://github.com/n9e/fe-v5找到最新版本下载,本次使用5.2.1
tarball=n9e-5.6.2.tar.gz
urlpath=https://github.com/didi/nightingale/releases/download/v5.6.2/${tarball}
wget $urlpath || exit 1

tar zxvf ${tarball}

mysql -uroot -p1234 < docker/initsql/a-n9e.sql

nohup ./n9e server &> server.log &
nohup ./n9e webapi &> webapi.log &

# check logs
# check port
- 如果启动成功,server 默认会监听在 19000 端口,webapi 会监听在 18000 端口,且日志没有报错。上面使用 nohup 简单演示,生产环境建议用 systemd 托管,相关 service 文件可以在 etc/service 目录下,供参考。
- 配置文件etc/server.conf和etc/webapi.conf中都含有 mysql 的连接地址配置,检查一下用户名和密码,prometheus 如果使用上面的脚本安装,默认会监听本机 9090 端口,server.conf 和 webapi.conf 中的 prometheus 相关地址都不用修改就是对的。
- 浏览器访问 webapi 的端口(默认是18000)就可以体验相关功能了,默认用户是root,密码是root.2020.
四、后置Agent服务
1.linux版本安装配置
代码如下(示例):
#!/bin/sh

version=1.20.4
tarball=telegraf-${version}_linux_amd64.tar.gz
wget https://dl.influxdata.com/telegraf/releases/$tarball
tar xzvf $tarball

mkdir -p /opt/telegraf
cp -far telegraf-${version}/usr/bin/telegraf /opt/telegraf

cat <<EOF > /opt/telegraf/telegraf.conf
[global_tags]

[agent]
  interval = "10s"
  round_interval = true
  metric_batch_size = 1000
  metric_buffer_limit = 10000
  collection_jitter = "0s"
  flush_interval = "10s"
  flush_jitter = "0s"
  precision = ""
  hostname = ""
  omit_hostname = false

[[outputs.opentsdb]]
  host = "http://127.0.0.1"
  port = 19000
  http_batch_size = 50
  http_path = "/opentsdb/put"
  debug = false
  separator = "_"

[[inputs.cpu]]
  percpu = true
  totalcpu = true
  collect_cpu_time = false
  report_active = true

[[inputs.disk]]
  ignore_fs = ["tmpfs", "devtmpfs", "devfs", "iso9660", "overlay", "aufs", "squashfs"]

[[inputs.diskio]]

[[inputs.kernel]]

[[inputs.mem]]

[[inputs.processes]]

[[inputs.system]]
  fielddrop = ["uptime_format"]

[[inputs.net]]
  ignore_protocol_stats = true

EOF

cat <<EOF > /etc/systemd/system/telegraf.service
[Unit]
Description="telegraf"
After=network.target

[Service]
Type=simple

ExecStart=/opt/telegraf/telegraf --config telegraf.conf
WorkingDirectory=/opt/telegraf

SuccessExitStatus=0
LimitNOFILE=65536
StandardOutput=syslog
StandardError=syslog
SyslogIdentifier=telegraf
KillMode=process
KillSignal=SIGQUIT
TimeoutStopSec=5
Restart=always

[Install]
WantedBy=multi-user.target
EOF

systemctl daemon-reload
systemctl enable telegraf
systemctl restart telegraf
systemctl status telegraf
-
telegraf.conf的内容是个删减版,只是为了让大家快速跑起来,如果要采集更多监控对象,比如mysql、redis、tomcat等,需要自己百度一下。
-
目前监控添加了端口,配置如下
[[inputs.net_response]]protocol = “tcp”
address = “192.168.136.5:18000”
timeout = “5s”
fielddrop = [“result_type”, “string_found”]
tagexclude = [“result”]
tags = {bu=“cloud”, region=“n9e_webapi”}
2.windows版本安装配置
-
从https://github.com/influxdata/telegraf/releases 下载telegraf,选择对应的windows版本,如:1.2.0.4

-
解压到C:\Program Files\telegraf下面,为后续注册成服务做准备
-
修改telegraf.conf文件,把[[outputs.influxdb]]标签内容注释掉,增加标签[[outputs.opentsdb]]内容,修改host =“你n9e-server的ip”,port = 19000;
[global_tags]

[agent]
	interval = "10s"
	round_interval = true
	metric_batch_size = 1000
	metric_buffer_limit = 10000
	collection_jitter = "0s"
	flush_interval = "10s"
	flush_jitter = "0s"
	precision = ""
	logfile = ""
	hostname = "192.168.136.1"
	omit_hostname = false

 [[outputs.opentsdb]]
	host = "http://192.168.136.5"
	port = 19000
	http_batch_size = 50
	http_path = "/opentsdb/put"
	debug = false
	separator = "_"

[[inputs.cpu]]
	percpu = true
	totalcpu = true
	collect_cpu_time = false
	report_active = false

[[inputs.disk]]
	ignore_fs = ["tmpfs", "devtmpfs", "devfs", "iso9660", "overlay", "aufs", "squashfs"]

[[inputs.kernel]]

[[inputs.mem]]

[[inputs.processes]]

[[inputs.swap]]

[[inputs.system]]
	fielddrop = ["uptime_format"]

[[inputs.net]]
	ignore_protocol_stats = true

[[inputs.net_response]]
	protocol = "tcp"
	address = "192.168.136.1:18080"
	timeout = "1s"
	fielddrop = ["result_type", "string_found"]
	tags = {bu="cloud", region="web_server"}
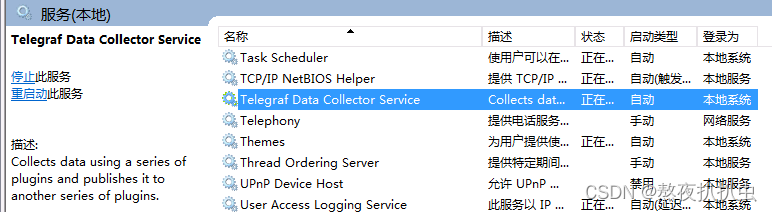
- 管理员权限打开powershell,执行:C:\Program Files\telegraf\telegraf.exe -service install,即注册成为windows的服务service,在"管理工具->服务"页可以查看到下图即为注册成功:
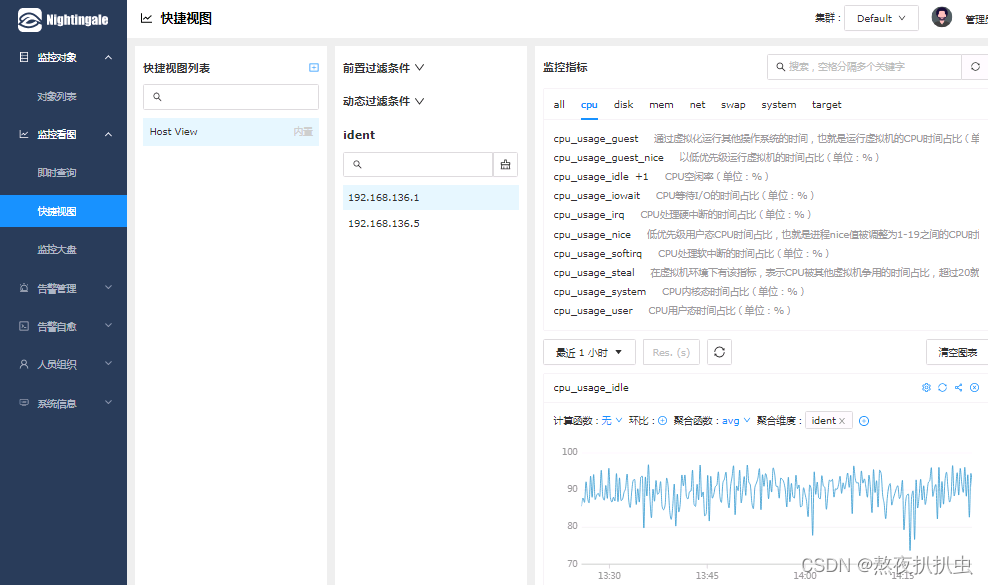
五、安装完成前端展示


为开发者提供学习成长、分享交流、生态实践、资源工具等服务,帮助开发者快速成长。
更多推荐


 0
0 0
0- 0


 已为社区贡献1条内容

所有评论(0)