使用Grafana+Prometheus配置服务器监控
文章目录前言一、Grafana安装和配置1.安装2.登录二、Prometheus安装和配置1.安装1.1 配置系统服务2.查看服务三、node_exporter安装和配置1.安装1.1 配置系统服务2.修改prometheus.yml配置3.查看服务四、Grafana配置prometheus1.配置数据源2.导入首页模板前言最近项目中需要监控服务器性能,采用的方案是Grafana+Promethe
文章目录
前言
最近项目中需要监控服务器性能,采用的方案是Grafana+Prometheus的方式,记录一下。
提示:所有链接中的localhost均指代被监控的服务器IP地址
一、Grafana安装和配置
1.安装
默认使用端口:3000
官方下载地址:https://grafana.com/grafana/download/7.4.0
下载命令:
wget https://dl.grafana.com/enterprise/release/grafana-enterprise-7.4.0-1.x86_64.rpm
安装命令:
sudo yum install grafana-enterprise-7.4.0-1.x86_64.rpm
启动命令:
systemctl start grafana-server // 启动
systemctl stop grafana-server // 停止
systemctl restart grafana-server // 重启

systemctl enable grafana-server // 允许开机自启动 或 chkconfig --add grafana-server
2.登录
默认登录地址:http://localhost:3000/,默认登录名/密码:admin/admin。

二、Prometheus安装和配置
1.安装
默认使用端口:9090
官方下载地址:https://prometheus.io/download/

下载后上传到部署的服务器,在服务上执行如下命令解压(root用户,解压到 /usr/local):
解压命令:
tar -vxf prometheus-2.32.1.linux-amd64.tar.gz -C /usr/local/
启动命令:
// 安装目录下启动 (/usr/local/prometheus-2.32.1.linux-amd64/)
nohup ./prometheus &    // 脱离终端后台运行
1.1 配置系统服务
在/usr/lib/systemd/system/目录下新建prometheus.service文件,输入以下内容:
# cat /usr/lib/systemd/system/prometheus.service
[Unit]
Description=prometheus service

[Service]
# forking background running
Type=forking
ExecStart=/usr/local/prometheus-2.32.1.linux-amd64/prometheus \
	--config.file=/usr/local/prometheus-2.32.1.linux-amd64/prometheus.yml \

TimeoutStopSec=10
Restart=on-failure
RestartSec=5

[Install]
WantedBy=multi-user.target
设置自启动
systemctl enable prometheus.service
2.查看服务
浏览器输入:http://localhost:9090/targets,若出现以下服务则代表prometheus服务启动成功。

三、node_exporter安装和配置
作用:node_exporter是用于收集操作系统的基本系统,例如cpu、内存、硬盘空间、I/O等信息等基本信息,并对外提供api接口用于prometheus查询。
1.安装
默认使用端口:9100
在Prometheus的下载页面下方就有node_exporter的下载链接:

下载后上传到部署的服务器,在服务上执行如下命令解压(root用户,解压到 /usr/local):
解压命令:
tar -vxf node_exporter-1.3.1.linux-amd64.tar.gz -C /usr/local/
启动命令:
// 安装目录下启动 (/usr/local/node_exporter-1.3.1.linux-amd64/)
nohup ./node_exporter &    // 脱离终端后台运行
1.1 配置系统服务
在/usr/lib/systemd/system/目录下新建node_exporter.service文件,输入以下内容:
# cat /usr/lib/systemd/system/node_exporter.service
[Unit]
Description=node_exporter service

[Service]
# forking background running
Type=forking
ExecStart=/usr/local/node_exporter-1.3.1.linux-amd64/node_exporter

TimeoutStopSec=10
Restart=on-failure
RestartSec=5

[Install]
WantedBy=multi-user.target
设置自启动
systemctl enable node_exporter.service
2.修改prometheus.yml配置
node_exporter安装成之后,需要在prometheus的配置文件prometheus.yml中添加:
#add node code
  - job_name: "node"
    static_configs:
       - targets: ["127.0.0.1:9100"]
修改保存后,重启prometheus服务。
3.查看服务
浏览器输入:http://localhost:9090/targets,若出现以下服务则代表node_exporter服务配置启动成功。

四、Grafana配置prometheus
1.配置数据源
Grafana登录之后,点击设置图标,配置Data Source数据源

选择Prometheus为数据源后,配置URL后,保存。


2.导入首页模板
配置成功之后就可以导入官方大佬分享的首页模板了。
地址:https://grafana.com/grafana/dashboards/
1.选择Node exporter

2.复制模板ID

3.导入模板

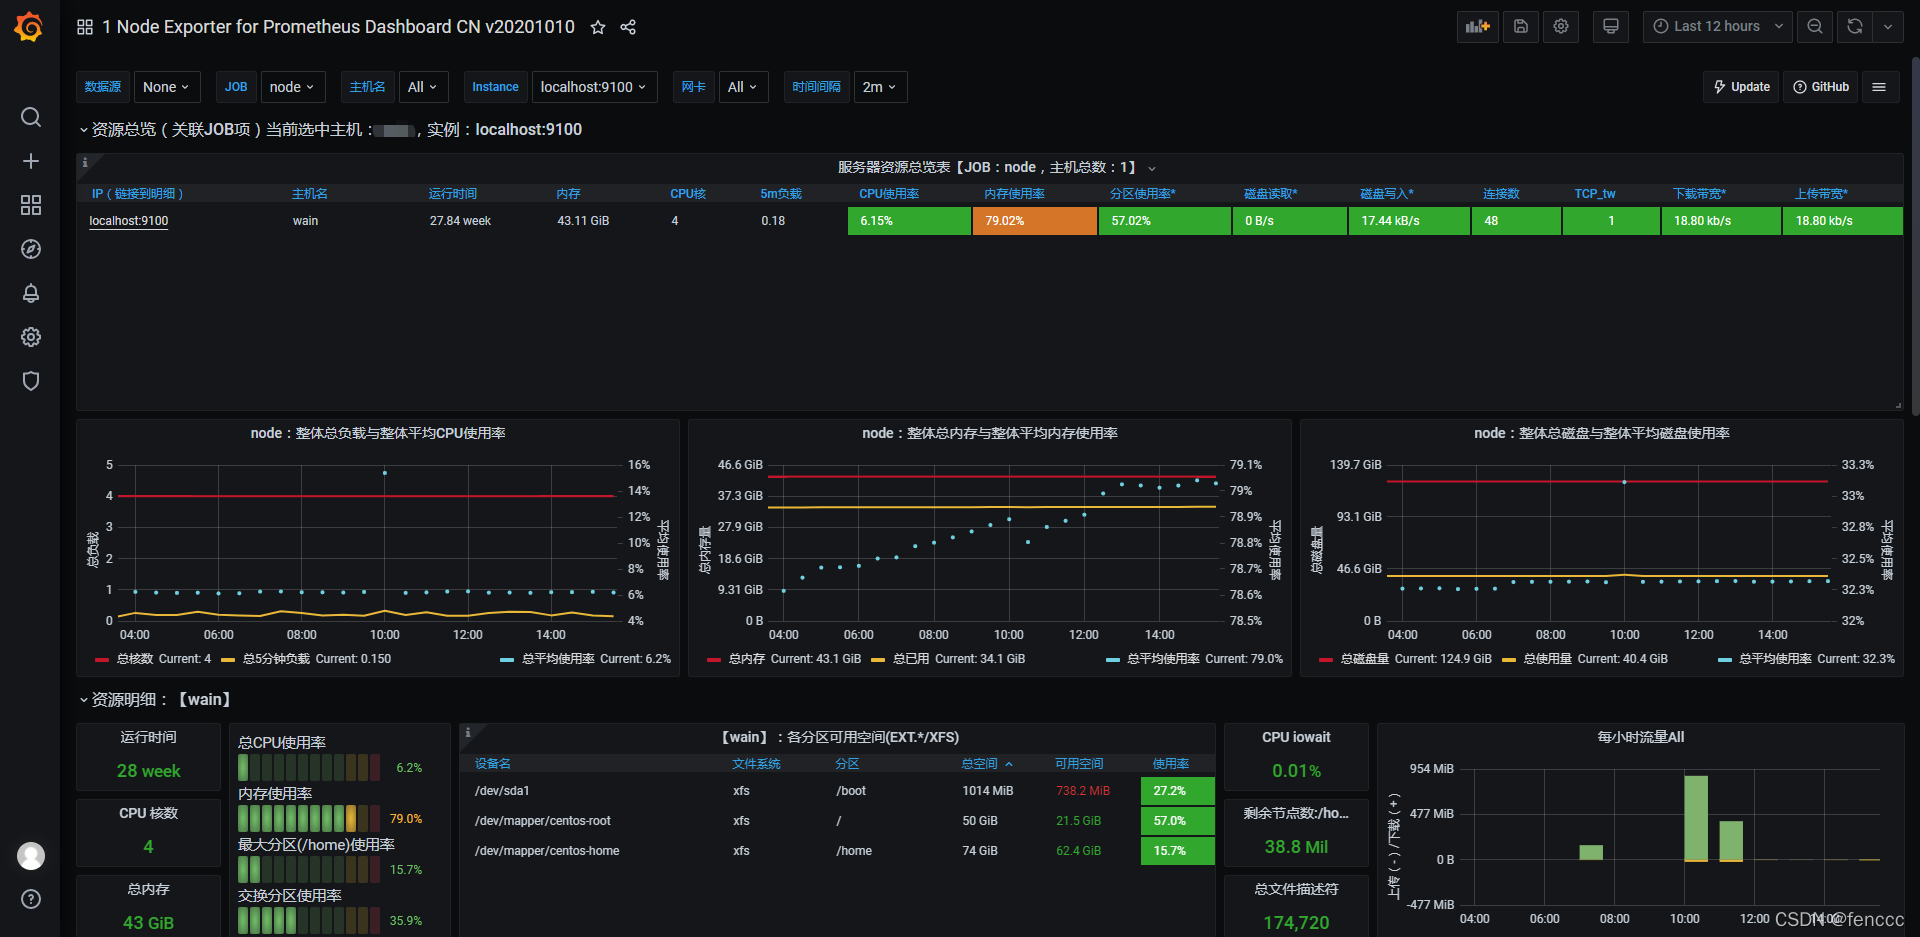
4.查看效果


华为开发者空间,是为全球开发者打造的专属开发空间,汇聚了华为优质开发资源及工具,致力于让每一位开发者拥有一台云主机,基于华为根生态开发、创新。
更多推荐


 2
2 0
0- 0


 已为社区贡献1条内容

所有评论(0)