Linux绘图工具gnuplot基本操作
1.gnuplot的安装sudo apt-get install gnuplotsudo apt-get install gnuplot-x112.测试使用输入gnuplot出现命令行,输入plot sin(x)画一条正弦曲线如图3.绘制的图形保存和查看(1)设置保存的图形类型为epsset term post eps保存为pdf格式set term pdfcairo保存为png格式set ter
1.gnuplot的安装
sudo apt-get install gnuplot
sudo apt-get install gnuplot-x11
2.测试使用
输入
gnuplot
出现命令行,输入
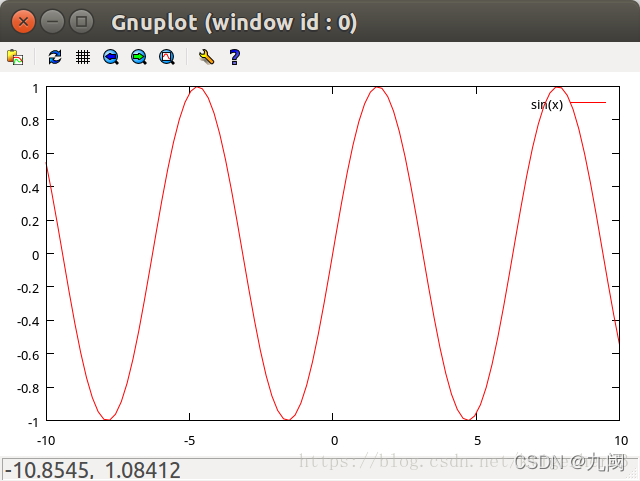
plot sin(x)
画一条正弦曲线
如图
3.绘制的图形保存和查看
(1)设置保存的图形类型为eps
set term post eps
保存为pdf格式
set term pdfcairo
保存为png格式
set term pngcairo
(2)设置保存的文件名
set output “test.eps”
(3)画曲线图形
plot sin(x)
此时不会弹出窗口
(4)点击test.eps就直接能够打开查看了(注意用一个 postscript 查看器/打印机就可以查看生成的文件,ubantu自带的图像查看器也可以打开)
4.加载文件并画图
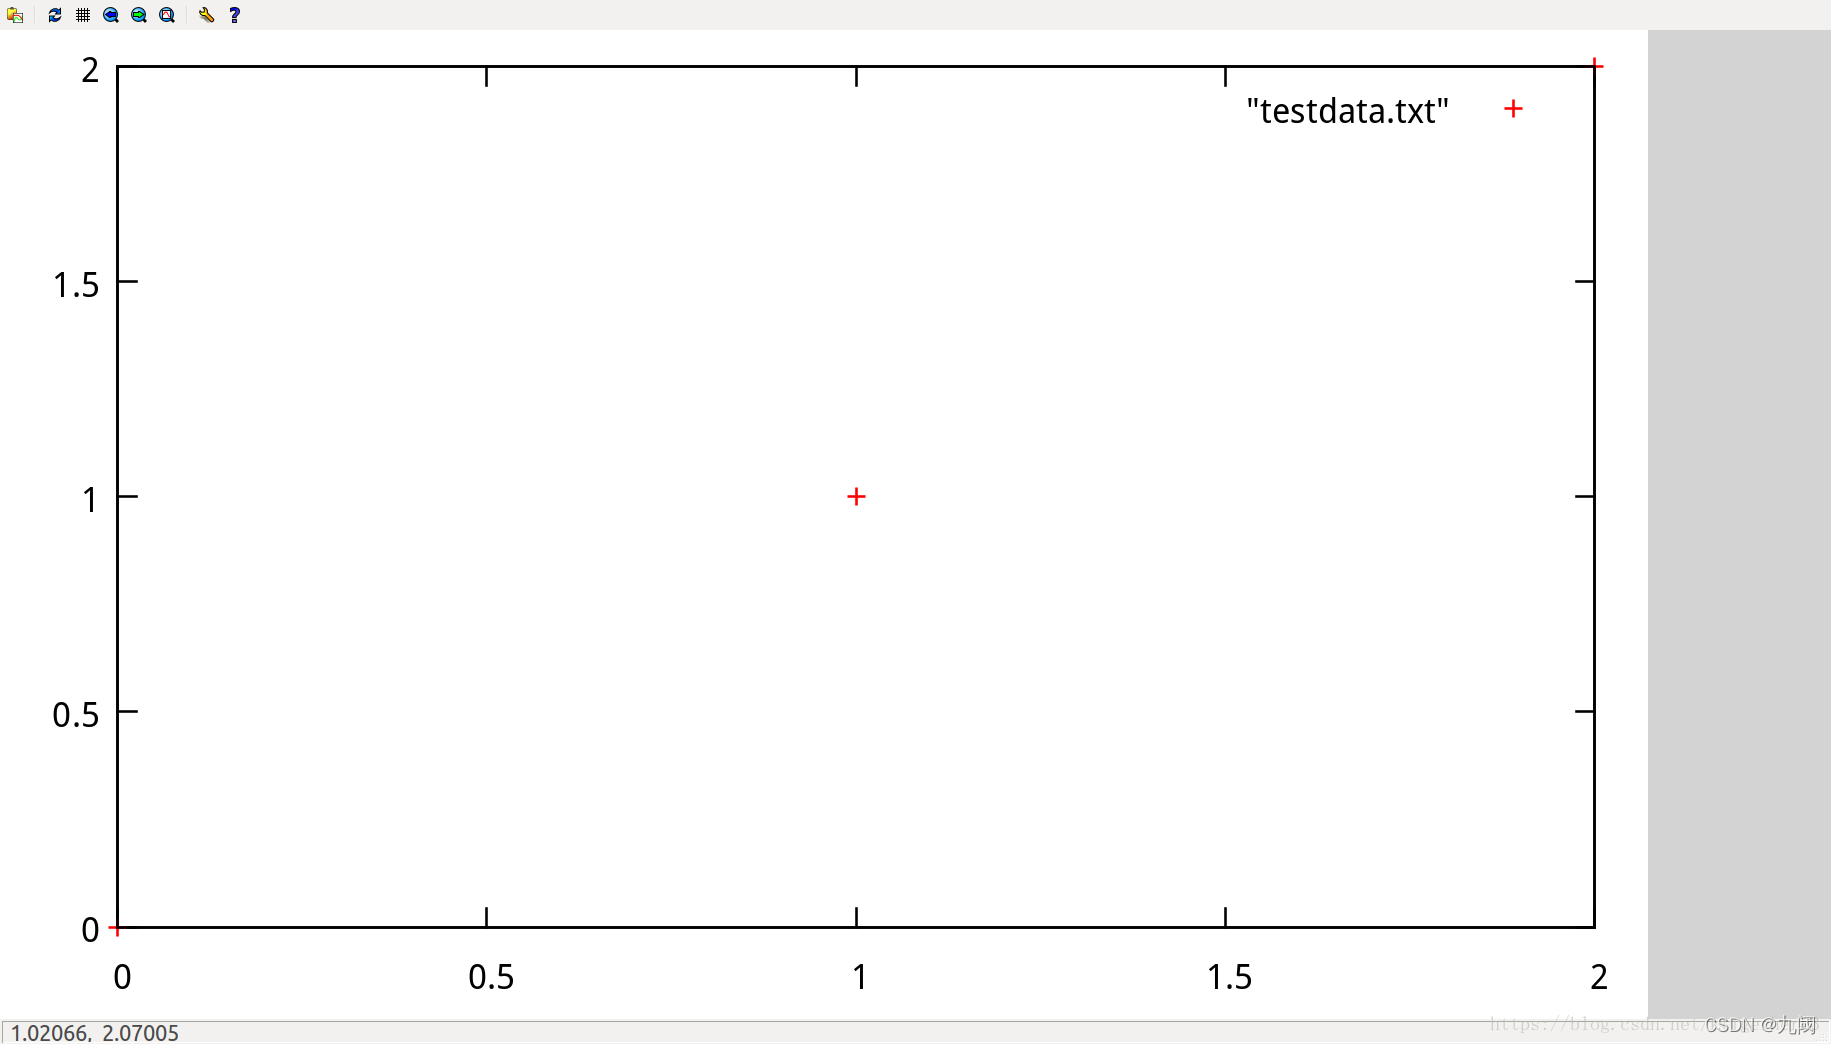
(1)在testdata.txt中加入以下内容,表示有三个点
0 0
1 1
2 2
(2)打开文件并并画图
reset
plot "testdata.txt"
如图
(3)给点连上直线
在后面加上with linespoints
plot "testdata.txt" with linespoints
5.设置文件中的某列作为x或y轴坐标
设testdata.txt内容如下
1 0 0 1
2 1 1 1
3 2 2 1
选取第2列作为x,第3列作为y,画直线,如图
plot "testdata.txt" u 2:3 with linespoints
6.画三维的点
以testdata.txt中的第2列作为x,第3列作为y,第4列作为z画点
splot “testdata.txt” u 2:3:4
7.同一张图上画多条轨迹
只要每个函数用英文逗号隔开就可以了
如
plot "testdata.txt" u 2 w lp lt 1 title 'x', "testdata.txt" u 3 w lp lt 2 title 'y'
同一个图像画出第二列和第三列的数据
8.不同图上画不同轨迹
需要添加set multiplot layout 行,列 指令
如
reset
set multiplot layout 2,1
plot "testdata.txt" u 2 w lp  lt 1 title 'x',
plot "testdata.txt" u 3 w lp lt 2 title 'y'
文章来源:https://blog.csdn.net/ktigerhero3/article/details/80928859
推荐:
https://blog.csdn.net/weixin_38468077/article/details/101069365

为开发者提供学习成长、分享交流、生态实践、资源工具等服务,帮助开发者快速成长。
更多推荐


 3
3 0
0- 0


 已为社区贡献13条内容

所有评论(0)