linux进阶23——GDB(九):gdb调试coredump
1. coredump
1. coredump
Coredump叫做核心转储,它是进程运行时在突然崩溃的那一刻的一个内存快照。操作系统在程序发生异常而异常在进程内部又没有被捕获的情况下,会把进程此刻内存、寄存器状态、运行堆栈等信息转储保存在一个文件里。
2. coredump产生原因
1. 内存访问越界
1)由于使用错误的下标,导致数组访问越界
2)搜索字符串时,依靠字符串结束符来判断字符串是否结束,但是字符串没有正常的使用结束符
3)使用strcpy, strcat, sprintf, strcmp, strcasecmp等字符串操作函数,将目标字符串读/写爆。应该使用strncpy, strlcpy, strncat, strlcat, snprintf, strncmp, strncasecmp等函数防止读写越界。
2. 多线程程序使用了线程不安全的函数
3. 线程读写的数据未加锁保护。对于会被多个线程同时访问的全局数据,应该注意加锁保护,否则很容易造成core dump。
4. 非法指针
1)使用空指针
2)随意使用指针转换。一个指向一段内存的指针,除非确定这段内存原先就分配为某种结构或类型,或者这种结构或类型的数组,否则不要将它转换为这种结构或类型的指针,而应该将这段内存拷贝到一个这种结构或类型中,再访问这个结构或类型。这是因为如果这段内存的开始地址不是按照这种结构或类型对齐的,那么访问它时就很容易因为bus error而core dump.
5. 堆栈溢出。不要使用大的局部变量(因为局部变量都分配在栈上),这样容易造成堆栈溢出,破坏系统的栈和堆结构,导致出现莫名其妙的错误。
3. 设置
1. 查看core文件存储的位置
[root@localhost ~]# cat /proc/sys/kernel/core_pattern
core
[root@localhost ~]#
2. 修改core的位置
[root@localhost day7]# echo "/home/gdb/day7/core.%e.%p" > /proc/sys/kernel/core_pattern
[root@localhost day7]#
说明:
%e:程序文件的完整路径(路径中的/会被!替代)
%p:进程 ID
%t:进程奔溃的时间戳
%s:哪个信号让进程奔溃
3. 修改core文件的大小
linux系统默认生成core文件时空,可以用命令查看
ulimit -c
//详细信息
ulimit -a

如果结果是0,我们需要修改其大小
//当前有效的修改
ulimit -c [size]  //这里size一般修改为unlimited,或者是其他数字:2048
4. 示例
4.1 查看堆栈信息
一段c++程序:
#include <iostream>
#include <stdio.h>

void DumpCrash()
{
  	char* pStr = const_cast<char*>("lucas_test");
	free(pStr);
}

int main()
{
	DumpCrash();

	return 0;
}
编译运行:
[root@localhost day7]# g++ test1.cpp -o test1 -g
[root@localhost day7]# ./test1
*** Error in `./test1': free(): invalid pointer: 0x0000000000400775 ***
======= Backtrace: =========
/lib64/libc.so.6(+0x81329)[0x7f86fb7af329]
./test1[0x40067e]
./test1[0x40068a]
/lib64/libc.so.6(__libc_start_main+0xf5)[0x7f86fb750555]
./test1[0x4005b9]
======= Memory map: ========
00400000-00401000 r-xp 00000000 fd:02 3027315                            /home/gdb/day7/test1
00600000-00601000 r--p 00000000 fd:02 3027315                            /home/gdb/day7/test1
00601000-00602000 rw-p 00001000 fd:02 3027315                            /home/gdb/day7/test1
01ca0000-01cd2000 rw-p 00000000 00:00 0                                  [heap]
7f86f4000000-7f86f4021000 rw-p 00000000 00:00 0
7f86f4021000-7f86f8000000 ---p 00000000 00:00 0
7f86fb72e000-7f86fb8f2000 r-xp 00000000 fd:00 34689921                   /usr/lib64/libc-2.17.so
7f86fb8f2000-7f86fbaf1000 ---p 001c4000 fd:00 34689921                   /usr/lib64/libc-2.17.so
7f86fbaf1000-7f86fbaf5000 r--p 001c3000 fd:00 34689921                   /usr/lib64/libc-2.17.so
7f86fbaf5000-7f86fbaf7000 rw-p 001c7000 fd:00 34689921                   /usr/lib64/libc-2.17.so
7f86fbaf7000-7f86fbafc000 rw-p 00000000 00:00 0
7f86fbafc000-7f86fbb11000 r-xp 00000000 fd:00 33554508                   /usr/lib64/libgcc_s-4.8.5-20150702.so.1
7f86fbb11000-7f86fbd10000 ---p 00015000 fd:00 33554508                   /usr/lib64/libgcc_s-4.8.5-20150702.so.1
7f86fbd10000-7f86fbd11000 r--p 00014000 fd:00 33554508                   /usr/lib64/libgcc_s-4.8.5-20150702.so.1
7f86fbd11000-7f86fbd12000 rw-p 00015000 fd:00 33554508                   /usr/lib64/libgcc_s-4.8.5-20150702.so.1
7f86fbd12000-7f86fbe13000 r-xp 00000000 fd:00 33588193                   /usr/lib64/libm-2.17.so
7f86fbe13000-7f86fc012000 ---p 00101000 fd:00 33588193                   /usr/lib64/libm-2.17.so
7f86fc012000-7f86fc013000 r--p 00100000 fd:00 33588193                   /usr/lib64/libm-2.17.so
7f86fc013000-7f86fc014000 rw-p 00101000 fd:00 33588193                   /usr/lib64/libm-2.17.so
7f86fc014000-7f86fc1d1000 r-xp 00000000 fd:00 68377054                   /usr/lib/libstdc++.so.6.0.28
7f86fc1d1000-7f86fc3d0000 ---p 001bd000 fd:00 68377054                   /usr/lib/libstdc++.so.6.0.28
7f86fc3d0000-7f86fc3db000 r--p 001bc000 fd:00 68377054                   /usr/lib/libstdc++.so.6.0.28
7f86fc3db000-7f86fc3de000 rw-p 001c7000 fd:00 68377054                   /usr/lib/libstdc++.so.6.0.28
7f86fc3de000-7f86fc3e1000 rw-p 00000000 00:00 0
7f86fc3e1000-7f86fc403000 r-xp 00000000 fd:00 34689917                   /usr/lib64/ld-2.17.so
7f86fc5f3000-7f86fc5f8000 rw-p 00000000 00:00 0
7f86fc600000-7f86fc602000 rw-p 00000000 00:00 0
7f86fc602000-7f86fc603000 r--p 00021000 fd:00 34689917                   /usr/lib64/ld-2.17.so
7f86fc603000-7f86fc604000 rw-p 00022000 fd:00 34689917                   /usr/lib64/ld-2.17.so
7f86fc604000-7f86fc605000 rw-p 00000000 00:00 0
7ffc37407000-7ffc37428000 rw-p 00000000 00:00 0                          [stack]
7ffc375a7000-7ffc375a9000 r-xp 00000000 00:00 0                          [vdso]
ffffffffff600000-ffffffffff601000 r-xp 00000000 00:00 0                  [vsyscall]
已放弃(吐核)
[root@localhost day7]# ls
core.test1.1768  test1  test1.cpp
[root@localhost day7]#
执行完可执行程序后,生成了core文件。
调试查看堆栈信息:
[root@localhost day7]# ls
core.test1.1768  test1  test1.cpp
[root@localhost day7]# gdb test1
GNU gdb (GDB) Red Hat Enterprise Linux 7.6.1-120.el7
Copyright (C) 2013 Free Software Foundation, Inc.
License GPLv3+: GNU GPL version 3 or later <http://gnu.org/licenses/gpl.html>
This is free software: you are free to change and redistribute it.
There is NO WARRANTY, to the extent permitted by law.  Type "show copying"
and "show warranty" for details.
This GDB was configured as "x86_64-redhat-linux-gnu".
For bug reporting instructions, please see:
<http://www.gnu.org/software/gdb/bugs/>...
Reading symbols from /home/gdb/day7/test1...done.
(gdb) core-file core.test1.1768
[New LWP 1768]
Core was generated by `./test1'.
Program terminated with signal 6, Aborted.
#0  0x00007f86fb7643d7 in raise () from /lib64/libc.so.6
Missing separate debuginfos, use: debuginfo-install glibc-2.17-323.el7_9.x86_64 libgcc-4.8.5-44.el7.x86_64
(gdb) bt
#0  0x00007f86fb7643d7 in raise () from /lib64/libc.so.6
#1  0x00007f86fb765ac8 in abort () from /lib64/libc.so.6
#2  0x00007f86fb7a6f67 in __libc_message () from /lib64/libc.so.6
#3  0x00007f86fb7af329 in _int_free () from /lib64/libc.so.6
#4  0x000000000040067e in DumpCrash () at test1.cpp:7
#5  0x000000000040068a in main () at test1.cpp:12
(gdb) where
#0  0x00007f86fb7643d7 in raise () from /lib64/libc.so.6
#1  0x00007f86fb765ac8 in abort () from /lib64/libc.so.6
#2  0x00007f86fb7a6f67 in __libc_message () from /lib64/libc.so.6
#3  0x00007f86fb7af329 in _int_free () from /lib64/libc.so.6
#4  0x000000000040067e in DumpCrash () at test1.cpp:7
#5  0x000000000040068a in main () at test1.cpp:12
(gdb)
4.2 寻找this指针和虚指针
一段程序:
#include <stdio.h>
#include <iostream>
#include <stdlib.h>
using namespace std;

class base
{
public:
    base();
    virtual void test();
private:
    char *basePStr = nullptr;
};

class dumpTest : public base
{
public:
    void test();
private:
    char *childPStr = nullptr;
};

base::base()
{
    basePStr = "test_info";
}

void base::test()
{
    cout<<basePStr<<endl;
}

void dumpTest::test()
{
    cout<<"dumpTest"<<endl;
    delete childPStr;
}

void dumpCrash()
{
    char *pStr = "test_content";
    free(pStr);
}

int main()
{
    dumpTest dump;
    dump.test();
    return 0;
}
如上代码,实现了一个简单的基类和一个子类。在main函数里定义一个子类的实例化对象,并调用它的虚函数方法test,test里由于直接delete没有初始化的指针childPStr,肯定会造coredump。本次我们就希望通过dump文件,找到子类dumpTest的this指针和虚函数指针。
编译运行程序:
[root@localhost day8]# g++ test1.cpp -o test1 -g
[root@localhost day8]# ls
test1  test1.cpp
[root@localhost day8]# ./test1
dumpTest
*** Error in `./test1': free(): invalid size: 0x00007ffea0149760 ***
======= Backtrace: =========
/lib64/libc.so.6(+0x81329)[0x7fe97d76d329]
./test1[0x4009f4]
./test1[0x400902]
/lib64/libc.so.6(__libc_start_main+0xf5)[0x7fe97d70e555]
./test1[0x400839]
======= Memory map: ========
00400000-00401000 r-xp 00000000 fd:02 3027318                            /home/gdb/day8/test1
00600000-00601000 r--p 00000000 fd:02 3027318                            /home/gdb/day8/test1
00601000-00602000 rw-p 00001000 fd:02 3027318                            /home/gdb/day8/test1
01139000-0116b000 rw-p 00000000 00:00 0                                  [heap]
7fe97d6ec000-7fe97d8b0000 r-xp 00000000 fd:00 34689921                   /usr/lib64/libc-2.17.so
7fe97d8b0000-7fe97daaf000 ---p 001c4000 fd:00 34689921                   /usr/lib64/libc-2.17.so
7fe97daaf000-7fe97dab3000 r--p 001c3000 fd:00 34689921                   /usr/lib64/libc-2.17.so
7fe97dab3000-7fe97dab5000 rw-p 001c7000 fd:00 34689921                   /usr/lib64/libc-2.17.so
7fe97dab5000-7fe97daba000 rw-p 00000000 00:00 0
7fe97daba000-7fe97dacf000 r-xp 00000000 fd:00 33554508                   /usr/lib64/libgcc_s-4.8.5-20150702.so.1
7fe97dacf000-7fe97dcce000 ---p 00015000 fd:00 33554508                   /usr/lib64/libgcc_s-4.8.5-20150702.so.1
7fe97dcce000-7fe97dccf000 r--p 00014000 fd:00 33554508                   /usr/lib64/libgcc_s-4.8.5-20150702.so.1
7fe97dccf000-7fe97dcd0000 rw-p 00015000 fd:00 33554508                   /usr/lib64/libgcc_s-4.8.5-20150702.so.1
7fe97dcd0000-7fe97ddd1000 r-xp 00000000 fd:00 33588193                   /usr/lib64/libm-2.17.so
7fe97ddd1000-7fe97dfd0000 ---p 00101000 fd:00 33588193                   /usr/lib64/libm-2.17.so
7fe97dfd0000-7fe97dfd1000 r--p 00100000 fd:00 33588193                   /usr/lib64/libm-2.17.so
7fe97dfd1000-7fe97dfd2000 rw-p 00101000 fd:00 33588193                   /usr/lib64/libm-2.17.so
7fe97dfd2000-7fe97e18f000 r-xp 00000000 fd:00 68377054                   /usr/lib/libstdc++.so.6.0.28
7fe97e18f000-7fe97e38e000 ---p 001bd000 fd:00 68377054                   /usr/lib/libstdc++.so.6.0.28
7fe97e38e000-7fe97e399000 r--p 001bc000 fd:00 68377054                   /usr/lib/libstdc++.so.6.0.28
7fe97e399000-7fe97e39c000 rw-p 001c7000 fd:00 68377054                   /usr/lib/libstdc++.so.6.0.28
7fe97e39c000-7fe97e39f000 rw-p 00000000 00:00 0
7fe97e39f000-7fe97e3c1000 r-xp 00000000 fd:00 34689917                   /usr/lib64/ld-2.17.so
7fe97e5b1000-7fe97e5b6000 rw-p 00000000 00:00 0
7fe97e5bd000-7fe97e5c0000 rw-p 00000000 00:00 0
7fe97e5c0000-7fe97e5c1000 r--p 00021000 fd:00 34689917                   /usr/lib64/ld-2.17.so
7fe97e5c1000-7fe97e5c2000 rw-p 00022000 fd:00 34689917                   /usr/lib64/ld-2.17.so
7fe97e5c2000-7fe97e5c3000 rw-p 00000000 00:00 0
7ffea0000000-7ffea014b000 rw-p 00000000 00:00 0                          [stack]
7ffea01e7000-7ffea01e9000 r-xp 00000000 00:00 0                          [vdso]
ffffffffff600000-ffffffffff601000 r-xp 00000000 00:00 0                  [vsyscall]
已放弃(吐核)
[root@localhost day8]# ls
core.test1.1900  test1  test1.cpp
[root@localhost day8]#
gdb调试:
[root@localhost day8]# gdb test1
GNU gdb (GDB) Red Hat Enterprise Linux 7.6.1-120.el7
Copyright (C) 2013 Free Software Foundation, Inc.
License GPLv3+: GNU GPL version 3 or later <http://gnu.org/licenses/gpl.html>
This is free software: you are free to change and redistribute it.
There is NO WARRANTY, to the extent permitted by law.  Type "show copying"
and "show warranty" for details.
This GDB was configured as "x86_64-redhat-linux-gnu".
For bug reporting instructions, please see:
<http://www.gnu.org/software/gdb/bugs/>...
Reading symbols from /home/gdb/day8/test1...done.
(gdb) core-file core.test1.1900
[New LWP 1900]
Core was generated by `./test1'.
Program terminated with signal 6, Aborted.
#0  0x00007fe97d7223d7 in raise () from /lib64/libc.so.6
Missing separate debuginfos, use: debuginfo-install glibc-2.17-323.el7_9.x86_64 libgcc-4.8.5-44.el7.x86_64
(gdb) bt
#0  0x00007fe97d7223d7 in raise () from /lib64/libc.so.6
#1  0x00007fe97d723ac8 in abort () from /lib64/libc.so.6
#2  0x00007fe97d764f67 in __libc_message () from /lib64/libc.so.6
#3  0x00007fe97d76d329 in _int_free () from /lib64/libc.so.6
#4  0x00000000004009f4 in dumpTest::test (this=0x7ffea0149660) at test1.cpp:31
#5  0x0000000000400902 in main () at test1.cpp:41
(gdb)
如上,使用gdb打开core文件,同时bt打开core的堆栈信息。
然后跳到第4帧上,查看堆栈的寄存器信息
[root@localhost day8]# gdb test1
GNU gdb (GDB) Red Hat Enterprise Linux 7.6.1-120.el7
Copyright (C) 2013 Free Software Foundation, Inc.
License GPLv3+: GNU GPL version 3 or later <http://gnu.org/licenses/gpl.html>
This is free software: you are free to change and redistribute it.
There is NO WARRANTY, to the extent permitted by law.  Type "show copying"
and "show warranty" for details.
This GDB was configured as "x86_64-redhat-linux-gnu".
For bug reporting instructions, please see:
<http://www.gnu.org/software/gdb/bugs/>...
Reading symbols from /home/gdb/day8/test1...done.
(gdb) core-file core.test1.1900
[New LWP 1900]
Core was generated by `./test1'.
Program terminated with signal 6, Aborted.
#0  0x00007fe97d7223d7 in raise () from /lib64/libc.so.6
Missing separate debuginfos, use: debuginfo-install glibc-2.17-323.el7_9.x86_64 libgcc-4.8.5-44.el7.x86_64
(gdb) bt
#0  0x00007fe97d7223d7 in raise () from /lib64/libc.so.6
#1  0x00007fe97d723ac8 in abort () from /lib64/libc.so.6
#2  0x00007fe97d764f67 in __libc_message () from /lib64/libc.so.6
#3  0x00007fe97d76d329 in _int_free () from /lib64/libc.so.6
#4  0x00000000004009f4 in dumpTest::test (this=0x7ffea0149660) at test1.cpp:31
#5  0x0000000000400902 in main () at test1.cpp:41
(gdb) f 4    <---------------------跳到第4帧上
#4  0x00000000004009f4 in dumpTest::test (this=0x7ffea0149660) at test1.cpp:31
31			delete childPStr;
(gdb) i f    <--------------------查看堆栈寄存器信息
Stack level 4, frame at 0x7ffea0149660:
 rip = 0x4009f4 in dumpTest::test (test1.cpp:31); saved rip 0x400902
 called by frame at 0x7ffea0149690, caller of frame at 0x7ffea0149640
 source language c++.
 Arglist at 0x7ffea0149650, args: this=0x7ffea0149660
 Locals at 0x7ffea0149650, Previous frame's sp is 0x7ffea0149660
 Saved registers:
  rbp at 0x7ffea0149650, rip at 0x7ffea0149658
(gdb) x 0x7ffea0149660   <-------------前一帧保存dump信息的位置
0x7ffea0149660:	0x00400ac8   <----------dump的this指针
(gdb) x 0x00400ac8       <----------this指针指向的第一个8字节0x0804893008048958就表示虚指针
0x400ac8 <_ZTV8dumpTest+16>:	0x004009b2
(gdb)  shell echo _ZTV8dumpTest|c++filt
vtable for dumpTest
(gdb) x 0x00400ac8-8
0x400ac0 <_ZTV8dumpTest+8>:	0x00400ae8
(gdb) x 0x00400ac8-16
0x400ab8 <_ZTV8dumpTest>:	0x00000000
(gdb) x 0x004009b2    <-------------存储函数test的位置
0x4009b2 <dumpTest::test()>:	0xe5894855
(gdb) x 0x004009b2 - 4
0x4009ae <base::test()+46>:	0x90c3c990
(gdb)
这里也印证了,在继承关系里,基类的虚函数是在子类虚函数的前面。
4.3 查看core进程的所有线程堆栈
一段程序:
#include <iostream>
#include <pthread.h>
#include <unistd.h>
using namespace std;
#define NUM_THREADS 5 //线程数
int count = 0;

void* say_hello( void *args )
{
    while(1)
    {
        sleep(1);
        cout<<"hello..."<<endl;
        if(NUM_THREADS ==  count)
        {
            char *pStr = (char*)"test";
            delete pStr;
        }
    }
} //函数返回的是函数指针,便于后面作为参数
int main()
{
    pthread_t tids[NUM_THREADS]; //线程id
    for( int i = 0; i < NUM_THREADS; ++i )
    {
        count = i+1;
        int ret = pthread_create( &tids[i], NULL, say_hello,NULL); //参数:创建的线程id,线程参数,线程运行函数的起始地址,运行函数的参数
        if( ret != 0 ) //创建线程成功返回0
        {
            cout << "pthread_create error:error_code=" << ret << endl;
        }
    }
    pthread_exit( NULL ); //等待各个线程退出后,进程才结束,否则进程强制结束,线程处于未终止的状态

    return 0;
}
编译并运行程序:
[root@localhost day8]# g++ -o test2  test2.cpp -lpthread -g
[root@localhost day8]# ls
test1  test1.cpp  test2  test2.cpp
[root@localhost day8]# ./test2
hello world
hello world
*** Error in `./test2': munmap_chunk(): invalid pointer: 0x0000000000400b55 ***
hello world
*** Error in `hello world
./test2hello world
*** Error in `./test2': munmap_chunk(): invalid pointer: 0x0000000000400b55 ***
======= Backtrace: =========
/lib64/libc.so.6(+0x7f474)[0x7f04d4fb0474]
./test2[0x4009dd]
/lib64/libpthread.so.0(+0x7ea5)[0x7f04d5bebea5]
/lib64/libc.so.6已放弃
[root@localhost day8]#
由于上面代码里在count等于5的时候,会delete一个未初始化的指针,肯定会coredump。
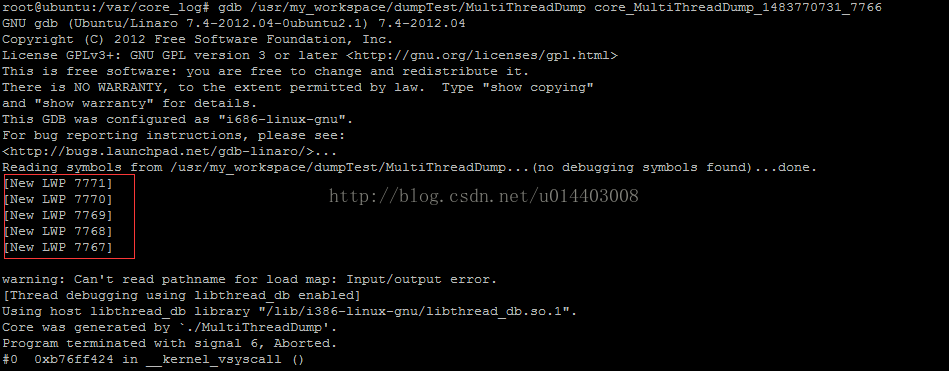
如上,gdb打开coredump文件,能看到5个线程LWP的信息。
如何,查看每个线程的堆栈信息呢?
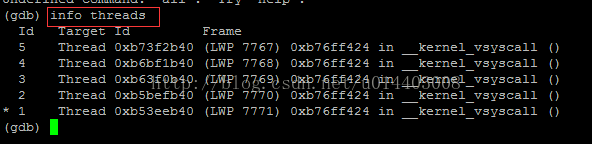
首先,info threads查看所有线程正在运行的指令信息
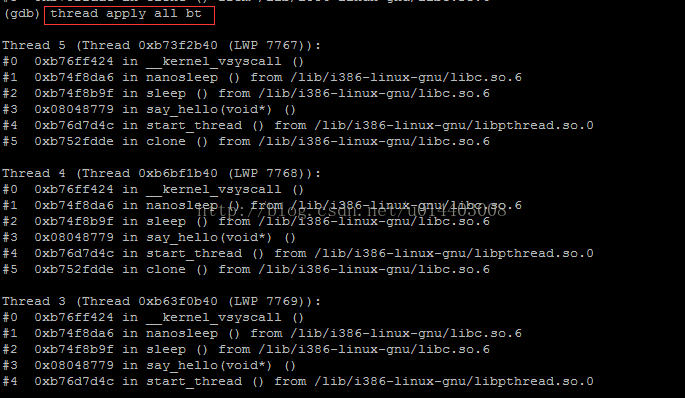
thread apply all bt打开所有线程的堆栈信息
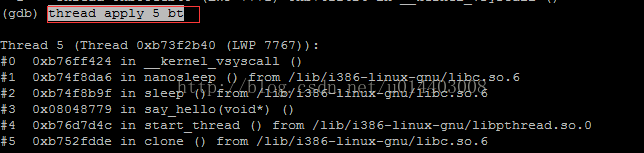
查看指定线程堆栈信息:threadapply threadID bt,如:
thread apply 5 bt
进入指定线程栈空间
thread threadID如下:
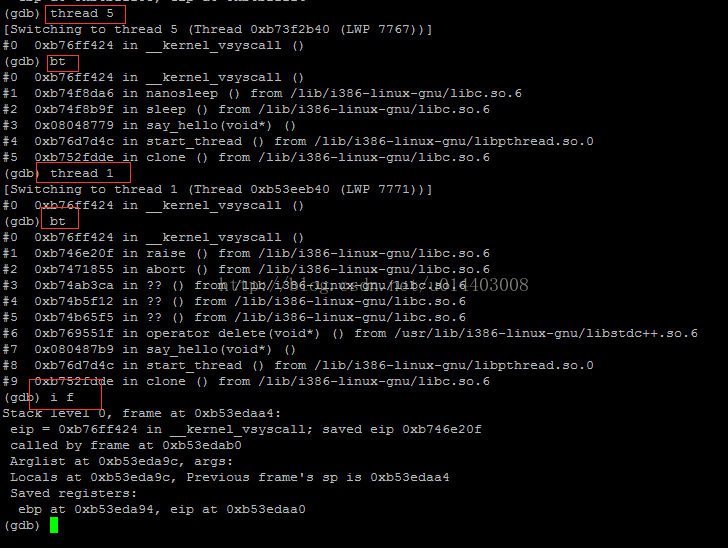
如上截图所示,可以跳转到指定的线程中,并查看所在线程的正在运行的堆栈信息和寄存器信息。

为开发者提供学习成长、分享交流、生态实践、资源工具等服务,帮助开发者快速成长。
更多推荐


 2
2 1
1- 0


 已为社区贡献10条内容

所有评论(0)