prometheus部署集群联邦
前言在生产环境中,如果使用一个prometheus的话,随着监控数据的持续增长,将会导致压力越来越大,这时候可以采用prometheus的集群联邦模式,就是部署多个prometheus的从节点,分别负责不同的监控数据采集,主节点负责汇总数据与grafana数据展示,可以很好地解决这种问题。架构图一、安装主节点1、解压安装包tar zxf prometheus-2.19.1.linux-amd64.
·
前言
在生产环境中,如果使用一个prometheus的话,随着监控数据的持续增长,将会导致压力越来越大,这时候可以采用prometheus的集群联邦模式,就是部署多个prometheus的从节点,分别负责不同的监控数据采集,主节点负责汇总数据与grafana数据展示,可以很好地解决这种问题。
架构图

一、安装主节点
1、解压安装包
tar zxf prometheus-2.19.1.linux-amd64.tar.gz -C /data/
2、配置
cd /data/prometheus-2.19.1.linux-amd64
vim prometheus.yml
scrape_configs:
  - job_name: 'federate'
    scrape_interval: 15s

    honor_labels: true
    metrics_path: '/federate'

    params:
      'match[]':
        - '{job="prometheus"}'
        - '{job="centos1"}'
        - '{job="centos2"}'
        - '{job="MySQL"}'
        - '{job="Redis"}'
        - '{job="web_status"}'
        - '{job="port_status"}'
        - '{job="ping_status"}'
        - '{job="process"}'
        - '{job="pushgateway"}'

    static_configs:
      - targets:
        - '192.168.84.128:9090'

alerting:
  alertmanagers:
  - static_configs:
    - targets: ["192.168.84.128:9093"]

rule_files:
   - rule.yml

remote_write:
  - url: "http://192.168.84.128:9201/write"
remote_read:
  - url: http://192.168.84.128:9201/read
3、启动
nohup ./prometheus --storage.tsdb.retention.time=6h --config.file=prometheus.yml &
二、部署从节点(下属节点)
1、解压安装包
tar zxf prometheus-2.19.1.linux-amd64.tar.gz -C /data/
2、配置
cd /data/prometheus-2.19.1.linux-amd64
vim prometheus.yml
scrape_configs:
  # The job name is added as a label `job=<job_name>` to any timeseries scraped from this config.
  - job_name: 'prometheus'

    # metrics_path defaults to '/metrics'
    # scheme defaults to 'http'.

    static_configs:
    - targets: ['0.0.0.0:9090']

  - job_name: 'centos1'
    static_configs:
    - targets: ['192.168.84.128:9100']
      labels:
        instance: centos1

  - job_name: 'centos2'
    static_configs:
    - targets: ['192.168.84.129:9100']
      labels:
        instance: centos2
  - job_name: 'MySQL'
    static_configs:
    - targets: ['192.168.84.128:9104']
  - job_name: 'Redis'
    static_configs:
    - targets: ['192.168.84.129:9121']


  - job_name: 'web_status'
    metrics_path: /probe
    params:
      module: [http_2xx]  # Look for a HTTP 200 response.
    static_configs:
      - targets:
        - http://192.168.84.128:3000    # Target to probe with http.
        - https://baidu.com
    relabel_configs:
      - source_labels: [__address__]
        target_label: __param_target
      - source_labels: [__param_target]
        target_label: instance
      - target_label: __address__
        replacement: 192.168.84.128:9115

#端口监控
  - job_name: 'port_status'
    metrics_path: /probe
    params:
      module: [tcp_connect]
    static_configs:
      - targets:
        - 192.168.84.128:80
        - 192.168.84.129:80
    relabel_configs:
      - source_labels: [__address__]
        target_label: __param_target
      - source_labels: [__param_target]
        target_label: instance
      - target_label: __address__
        replacement: 192.168.84.128:9115

#主机存活监控
  - job_name: 'ping_status'
    metrics_path: /probe
    params:
      module: [icmp]
    static_configs:
      - targets:
        - 192.168.84.128
        - 192.168.84.129
    relabel_configs:
      - source_labels: [__address__]
        target_label: __param_target
      - source_labels: [__param_target]
        target_label: instance
      - target_label: __address__
        replacement: 192.168.84.128:9115

  - job_name: 'process'
    static_configs:
    - targets: ['192.168.84.128:9256']

  - job_name: 'pushgateway'
    honor_labels: true
    static_configs:
      - targets: ['192.168.84.128:9091']
        labels:
          instance: pushgateway
3、启动
nohup ./prometheus --config.file=prometheus.yml &
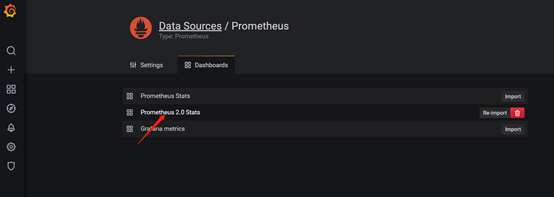
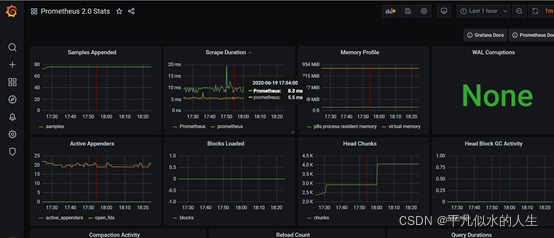
三、集成grafana
1、安装
wget https://dl.grafana.com/enterprise/release/grafana-enterprise-7.0.2-1.x86_64.rpm
sudo yum install grafana-enterprise-7.0.2-1.x86_64.rpm
2、配置
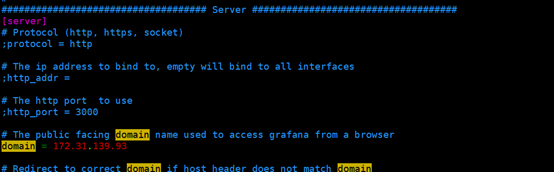
vim /etc/grafana/grafana.ini
3、启动
#默认端口:3000
/etc/init.d/grafana-server restart
4、访问grafana
http://172.31.139.93:3000
默认账户密码都是admin
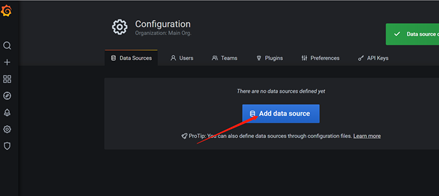
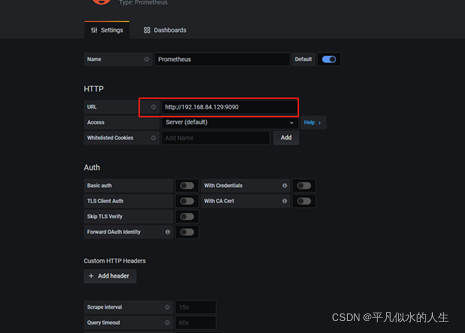
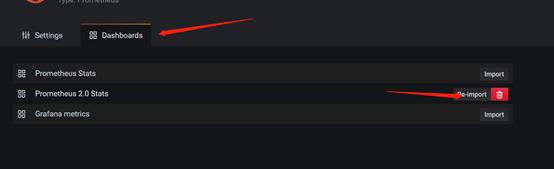
5、配置


6、安装常用插件
#添加图表插件
#饼图插件
grafana-cli plugins install grafana-piechart-panel

#时钟插件
grafana-cli plugins install grafana-clock-panel

#重启
/etc/init.d/grafana-server restart
结语
prometheus的集群联邦部署比较简单,如果需要HA的话可以把主节点部署成两个,配置负载均衡就可以了。

为开发者提供学习成长、分享交流、生态实践、资源工具等服务,帮助开发者快速成长。
更多推荐


 5
5 0
0- 0


 已为社区贡献7条内容

所有评论(0)