内存泄漏还可以这样查
一 前言对于C或C++程序员来说,面对的bug很大部分是内存操作问题,这其中比较令人头疼的就是内存泄漏了,虽然我们有valgrind 和AScan等内存问题的检测工具,但是valgrind每次输出一大堆,AScan有时候看输出结果看的是云里雾里的。再说,谁会嫌弃工具箱里面多个工具那。二 内存泄漏的一般检查2.1 基本准备内存泄漏问题的检查步骤,对于做过c或c++同学都比...
一 前言
对于C或C++程序员来说,面对的bug很大部分是内存操作问题,这其中比较令人头疼的就是内存泄漏了,虽然我们有valgrind 和AScan等内存问题的检测工具,但是valgrind每次输出一大堆,AScan有时候看输出结果看的是云里雾里的。再说,谁会嫌弃工具箱里面多个工具那。
二 内存泄漏的一般检查
2.1 基本准备
内存泄漏问题的检查步骤,对于做过c或c++同学都比较熟悉:
首先通过top或vmstat 、或smem(本次介绍)等工具查看内存情况,看看是否出现了内存泄漏。
其次用pidstat 或top指定进程的方式,观察可以进程内存占用情况。
用memleak或gdb工具查看内存泄漏。
先上测试代码:
#include <stdio.h>
#include <stdlib.h>
#include <pthread.h>
#include <unistd.h>

#define MALLOC_SIZE 256000

int *fibo(int *n0, int *n1)
{
    int *v = (int *) malloc(MALLOC_SIZE*sizeof(int));
    memset(v, 0, MALLOC_SIZE*sizeof(int));
    *v = *n0 + *n1;
    return v;
}

void do_test()
{
    int n0 = 0;
    int n1 = 1;
    int *v = NULL;
    int n = 2;
    for (n = 2; n > 0; n++)
     {
        v = fibo(&n0, &n1);
        n0 = n1;
        n1 = *v;
        printf("%dth => %lld\n", n, *v);
          //free(v)
     sleep(1);
     }
}

int main(void)
{
     printf("pid=%d\n", getpid());
     do_test();
     return 0;
}
程序比较简单,编译运行起来:
gcc memtest.c ; ./a.out2.2 smem工具
这次用下新工具smem,这是一个python写的小工具,可以统计系统中所有进程占用的物理内存RSS、以及去掉共享内存的PSS、以及程序本身的独占内存USS的情况。
安装:
# centos 下
yum install epel-release
yum install smem python-matplotlib python-tk

# ubuntu 下
apt-get install smem
常用命令:
-k 带单位显示内存
root@ubuntu-lab:/home/miao# smem -k
  PID User     Command                         Swap      USS      PSS      RSS
 1009 root     /usr/sbin/cron -f -P               0   304.0K   399.0K     2.9M
 1137 root     nginx: master process /usr/        0   196.0K   435.0K     2.1M
  931 root     /usr/sbin/irqbalance --fore        0   492.0K   655.0K     4.0M
....
-u -k 带单位显示每个用户的内存占用:
root@ubuntu-lab:/home/miao# smem -u -k
User     Count     Swap      USS      PSS      RSS
systemd-timesync     1        0   764.0K     1.1M     6.7M
messagebus     1        0   924.0K     1.2M     4.9M
systemd-network     1        0     1.7M     2.1M     7.4M
syslog       1        0     3.0M     3.1M     6.2M
www-data     4        0     2.0M     4.2M    22.4M
systemd-resolve     1        0     4.8M     5.8M    12.7M
miao         8        0    11.0M    16.9M    49.1M
postgres     7        0     9.2M    22.0M    74.5M
mysql        1        0    74.0M    74.7M    80.7M
root        30        0   260.7M   284.1M   429.5M
-w -k 显示系统整体内存情况类似free
root@ubuntu-lab:/home/miao# smem -w -k
Area                           Used      Cache   Noncache
firmware/hardware                 0          0          0
kernel image                      0          0          0
kernel dynamic memory          1.5G       1.3G     268.5M
userspace memory             414.0M     191.5M     222.5M
free memory                    2.8G       2.8G          0
-k -s uss -r 按照uss的占用从大到小排序的方式展示内存的占用情况 非常实用
root@ubuntu-lab:/home/miao# smem  -k -s uss -r
  PID User     Command                         Swap      USS      PSS      RSS
 1298 root     /usr/bin/dockerd -H                  0    74.3M    74.5M    77.9M
 1068 mysql    /usr/sbin/mariadbd                 0    74.0M    74.8M    80.7M
  939 root     /usr/lib/snapd/snapd               0    44.9M    45.0M    46.7M
....
好了基本命令介绍完毕,那我们来看看如何查看内存是否泄漏吧,因为内存泄漏的程序占用的内存是一直再增加的(这不是废话嘛),这样我们就可以用上面的排序命令只观察上面几个进程了。
watch smem -k -s uss -r小技巧,watch加在命令前面,5s执行一次命令,会高亮显示改变的部分。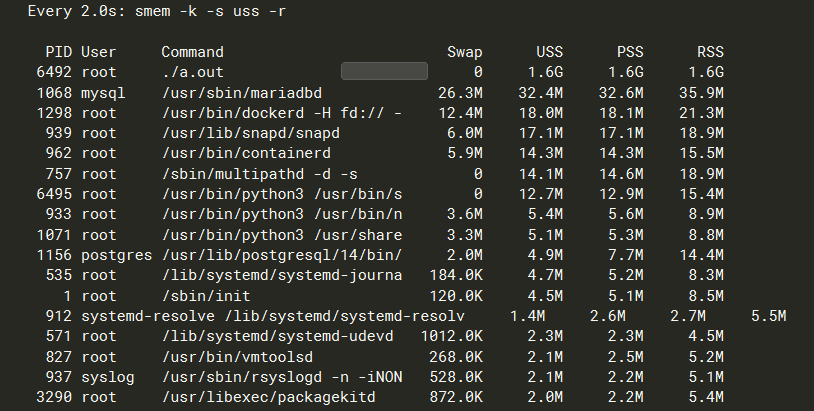
2.3 memleak检查
在ubuntu下安装memleak竟然很难安装,我用的是最新的服务器版本,后面在centos下安装后测试的:
[root@xxx]# python2 /usr/share/bcc/tools/memleak -p 160399
Attaching to pid 160399, Ctrl+C to quit.
[17:27:25] Top 10 stacks with outstanding allocations:
        5120000 bytes in 5 allocations from stack
                fibo+0x1a [a.out]
                do_test+0x41 [a.out]
                main+0x24 [a.out]
                __libc_start_main+0xf5 [libc-2.17.so]
[17:27:30] Top 10 stacks with outstanding allocations:
        10240000 bytes in 10 allocations from stack
                fibo+0x1a [a.out]
                do_test+0x41 [a.out]
                main+0x24 [a.out]
                __libc_start_main+0xf5 [libc-2.17.so]
[17:27:35] Top 10 stacks with outstanding allocations:
        15360000 bytes in 15 allocations from stack
                fibo+0x1a [a.out]
                do_test+0x41 [a.out]
                main+0x24 [a.out]
                __libc_start_main+0xf5 [libc-2.17.so]
[17:27:40] Top 10 stacks with outstanding allocations:
        19456000 bytes in 19 allocations from stack
fibo 函数出现内存泄漏,把泄漏的字节数都打印了出来,我们改了下代码把free的注释去掉,再用memleak查看等了一会还是没有泄漏信息,说明已经修复了,如下:
[root@xxx]# python2 /usr/share/bcc/tools/memleak -p 165349
Attaching to pid 165349, Ctrl+C to quit.
[17:35:21] Top 10 stacks with outstanding allocations:
[17:35:26] Top 10 stacks with outstanding allocations:
[17:35:31] Top 10 stacks with outstanding allocations:
[17:35:36] Top 10 stacks with outstanding allocations:
三 gdb 查看内存泄漏
也许你对memleak已经很熟悉了,那来看看gdb查看函数的内存泄漏方法吧,这个方法只是查看具体的一个函数是否存在内存泄漏,一定的场景下还是蛮实用的。把代码中的 for (n = 2; n > 0; n++) 改成 for (n = 2; n > 0&& n <10; n++)
(gdb) b main
Breakpoint 1 at 0x400739: file memleaktest.c, line 34.
(gdb) r
Starting program: /home/miaohq/testcode/./a.out

Breakpoint 1, main () at memleaktest.c:34
34               printf("pid=%d\n", getpid());
Missing separate debuginfos, use: debuginfo-install glibc-2.17-325.el7_9.x86_64
(gdb) call malloc_stats()
Arena 0:
system bytes     =          0
in use bytes     =          0
Total (incl. mmap):
system bytes     =          0
in use bytes     =          0
max mmap regions =          0
max mmap bytes   =          0
$1 = -136490560
(gdb) n
pid=181977
35                    do_test();
(gdb) call malloc_stats()
Arena 0:
system bytes     =          0
in use bytes     =          0
Total (incl. mmap):
system bytes     =          0
in use bytes     =          0
max mmap regions =          0
max mmap bytes   =          0
$2 = -136490560
(gdb) n
2th => 1
3th => 2
4th => 3
5th => 5
6th => 8
7th => 13
8th => 21
9th => 34
36                         return 0;
(gdb) call malloc_stats()
Arena 0:
system bytes     =          0
in use bytes     =          0
Total (incl. mmap):
system bytes     =    8224768
in use bytes     =    8224768
max mmap regions =          8
max mmap bytes   =    8224768
$3 = -136490560
(gdb) p 256000*4*8
$4 = 8192000
(gdb)
Total (incl. mmap):即本程序占用的总内存,看到明显的增加部分即为未释放的内存,程序使用的内存增加:8224768 稍大于 256000*4*8 分配的内存,内存分配需要存储链表还有一些对齐原因所以会多分配些。
free之后的场景:
(gdb) call malloc_stats()
Arena 0:
system bytes     =          0
in use bytes     =          0
Total (incl. mmap):
system bytes     =          0
in use bytes     =          0
max mmap regions =          0
max mmap bytes   =          0
$1 = -136490560
(gdb) n
pid=183406
35                    do_test();
(gdb) n
2th => 1
3th => 2
4th => 3
5th => 5
6th => 8
7th => 13
8th => 21
9th => 34
36                         return 0;
(gdb) call malloc_stats()
Arena 0:
system bytes     =    1159168
in use bytes     =          0
Total (incl. mmap):
system bytes     =    1159168
in use bytes     =          0
max mmap regions =          1
max mmap bytes   =    1028096
$2 = -136490560
(gdb)
in use bytes 为0了。

为开发者提供学习成长、分享交流、生态实践、资源工具等服务,帮助开发者快速成长。
更多推荐


 0
0 0
0- 0


 已为社区贡献1条内容

所有评论(0)