Prometheus 监控详解
文章目录一、常用监控系统介绍1. Cacti2. Nagios3. Zabbix4. Prometheus5. Open-falcon二、运维监控平台设计思路三、Prometheus 的监控体系四、Prometheus 简介五、Prometheus 时序数据六、Prometheus 生态组件七、Prometheus 数据模型八、Prometheus 安装一、常用监控系统介绍1. Cacti ca
文章目录
一、常用监控系统介绍
1. Cacti
cacti(英文含义为仙人掌)是一套基于 PHP、MySQL、SNMP 和 RRDtool 开发的网络流量监测图形分析工具。它通过 snmpget 来获取数据,使用 RRDTool 绘图,但使用者无须了解 RRDTool 复杂的参数。它提供了非常强大的数据和用户管理功能,可以指定每一个用户能查看树状结构、主机设备以及任何一张图,还可以与 LDAP 结合进行用户认证,同时也能自定义模板,在历史数据的展示监控方面,其功能相当不错。
cacti 通过添加模板,使不同设备的监控添加具有可复用性,并且具备可自定义绘图的功能,具有强大的运算能力(数据的叠加功能)。
2. Nagios
Nagios 是一款开源的免费网络监视工具,能有效监控 windows、Linux 和 Unix 的主机状态,交换机路由器等网络设置打印机等。在系统或服务状态异常时发出邮件或短信报警第一时间通知网站运维人员,在状态恢复后发出正常的邮件或短信通知。
Nagios 主要的特征是监控告警,最强大的就是告警功能,可支持多种告警方式,但缺点是没有强大的数据收集机制,并且数据出图也很简陋,当监控的主机越来越多时,添加主机也非常麻烦,配置文件都是基于文本配置的,不支持 web 方式管理和配置,这样很容易出错,不宜维护。
3. Zabbix
zabbix 是一个基于 web 界面的提供分布式系统监视以及网络监视功能的企业级的开源解决方案。zabbix 能监视各种网络参数,保证服务器系统的安全运营;并提供强大的通知机制以让系统运维人员快速定位/解决存在的各种问题。
zabbix 由 2 部分构成,zabbix server 与可选组件 zabbix agent。zabbix server 可以通过 SNMP,zabbix agent,ping,端口监视等方法提供对远程服务器/网络状态的监视,数据收集等功能,它可以运行在 Linux,Solaris,HP-UX,ALX,Free BSD,open BSD,os x 等平台上。
zabbix 解决了 cacti 没有告警的不足,也解决了 nagios 不能通过 web 配置的缺点,同时还支持分布式部署,这使得它迅速流行起来,zabbix 也成为目前中小企业监控最流行的运维监控平台。当然,zabbix 也有不足之处,它消耗的资源比较多,如果监控的主机非常多时(服务器数量超过 500 台),可能会出现监控超时、告警超时、告警系统单点故障等现象,不过也有很多解决办法,比如提高硬件性能、改变 zabbix 监控模式、多套 zabbix 等。
监控方式:
-
agent 代理:专门的代理服务方式进行监控,专属的协议,装有 zabbix-agent 的主机就可以被 zabbix-server 监控,主动或被动的方式,把数据给到 server 进行处理。
-
ssh/telnet:linux 主机支持 ssh/telnet 协议
-
snmp:网络设备路由器、交换机不能安装第三方程序(agent),使用简单网络协议。大多数的路由器设备支持 SNMP 协议。
-
ipmi:通过 ipmi 接口进行监控,我们可以通过标准的 ipmi 硬件接口,监控被监控对象的物理特征,比如电压,温度,风扇状态电源情况,被广泛使用服务监控中,包括采集 cpu 温度,风扇转速,主板温度,及远程开关机等等,而且 ipmi 独立于硬件和操作系统,无论是 cpu,bios 还是 os 出现故障,都不会影响 ipmi 的工作,因为 ipmi 的硬件设备 BMC(bashboard management controller)是独立的板卡,独立供电。
zabbix 核心组件介绍:
- zabbix server:zabbix 软件实现监控的核心程序,主要功能是与 zabbixproxies 和 agents 进行交互、触发器计算、发送告警通知;并将数据集中保存。与 prometheus 类似可以保存收集到的数据,但是 prometheus 告警需要使用 alter manager 组件。
- database storage:存储配置信息以及收集到的数据。
- web Interface:zabbix 的 GUI 接口,通常与 server 运行在同一台机器上。
- proxy:可选组件,常用于分布式监控环境中,一个帮助 zabbix server 收集数据,分担 zabbix server 的负载的程序。
- agent:部署在被监控主机上,负责收集数据发送给 server。
4. Prometheus
borg.kubernetes
borgmon(监控系统)对应克隆的版本:prometheus(go 语言开发)所以 prometheus 特别适合 K8S 的架构上。而作为一个数据监控解决方案,它由一个大型社区支持,有来自 700 多家公司的 6300 个贡献者,13500 个代码提交和 7200 个拉取请求。
prometheus 具有以下特性:
- 多维的数据模型(基于时间序列的 Key-value 键值对)
- 灵活的查询和聚合语言 PromQL
- 提供本地存储和分布式存储
- 通过基于 HTTP 和 HTTPS 的 Pull 模型采集时间序列数据(pull 数据的推送,时间序列:每段时间点的数据值指标,持续性的产生。横轴标识时间,纵轴为数据值,一段时间内数值的动态变化,所有的点连线形成大盘式的折线图)
- 可利用 Pushgateway(Prometheus 的可选中间件)实现 Push 模式
- 可通过动态服务发现或静态配置发现目标机器(通过 consul 自动发现和收缩)
- 支持多种图表和数据大盘
5. Open-falcon
open-falcon 是小米开源的企业级监控工具,用 go 语言开发,包括小米、滴滴、美团等在内的互联网公司都在使用它,是一款灵活、可拓展并且高性能的监控方案。
https://www.cnblogs.com/yinzhengjie/p/9946624.html
PS:
Nightingale 是滴滴基础平台联合滴滴云研发和开源的企业级监控解决方案。旨在满足云原生时代企业级的监控需求。
Nightingale 在产品完成度、系统高可用、以及用户体验方面,达到了企业级的要求,可满足不同规模用户的场景,小到几台机器,大到数十万都可以完美支撑。兼顾云原生和裸金属,支持应用监控和系统监控,插件机制灵活,插件丰富完善,具有高度的灵活性和可扩展性。
Nightingale 是一款分布式高性能的运维监控系统,在 Open-Falcon 的基础上,各核心模块做了大幅优化,引入了滴滴的生产实践经验结合滴滴内部的最佳实践,在性能、可维护性、易用性方面做了大量的改进, 作为集团统一的监控解决方案,支撑了滴滴内部数十亿监控指标,覆盖了从系统、容器、到应用等各层面的监控需求,周活跃用户数千。五年磨一剑,取之开源,回馈开源。夜莺 Fork 自 Open-Falcon,可以把夜莺看做是 Open-Falcon 的下一代。
https://cloud.tencent.com/developer/article/1638839?from=15425
二、运维监控平台设计思路
- 数据收集模块
- 数据提取模块
- 监控告警模块
可以细化为 6 层
第六层:用户展示管理层    同一用户管理、集中监控、集中维护
第五层:告警事件生成层    实时记录告警事件、形成分析图表(趋势分析、可视化)
第四层:告警规则配置层    告警规则设置、告警伐值设置
第三层:数据提取层    定时采集数据到监控模块
第二层:数据展示层    数据生成曲线图展示(对时序数据的动态展示)
第一层:数据收集层    多渠道监控数据
三、Prometheus 的监控体系
系统层监控(需要监控的数据)
- CPU、Load、Memory、swap、disk i/o、process 等
- 网络监控:网络设备、工作负载、网络延迟、丢包率等
中间件及基础设施类监控
- 消息中间件:kafka、redis、RocketMQ 等消息代理/中间件
- WEB 服务器容器:tomcat、weblogic、apache、php、spring 系列
- 数据库/缓存数据库:MySQL、PostgreSQL、MogoDB、es、redis
redis 监控内容:
- redis 所在服务器的系统层监控
- redis 服务状态
- RDB AOF 日志监控
(日志 -》如果是哨兵模式 -》哨兵共享集群信息,产生的日志 -》直接包含的其他节点哨兵信息及 mysql 信息)- key 的数量
- key 被命中的数据/次数
- 最大连接数 -》redis 和系统
(系统:ulimit -a。redis:redis-cli 登陆 -》config get maxclients 查看最大连接。)
应用层监控
用于衡量应用程序代码状态和性能
- 白盒监控:自省指标,等待被下载
- 黑盒监控:基于探针的监控方式,不会主动干预、影响数据
业务层监控
用于衡量应用程序的价值
- 如电商业务的销售量,QPS、dau 日活、转化率等。
- 业务接口:登入数量,注册数、订单量、搜索量和支付量。
四、Prometheus 简介
Prometheus 受启发于 Google 的 Brogmon 监控系统(相似的 Kubernetes 是从 Google 的 Brog 系统演变而来),从 2012 年开始由前 Google 工程师在 Soundcloud 以开源软件的形式进行研发,并且于 2015 年早期对外发布早期版本。 2016 年 5 月继 Kubernetes 之后成为第二个正式加入 CNCF 基金会的项目,同年 6 月正式发布 1.0 版本。2017 年底发布了基于全新存储层的 2.0 版本,能更好地与容器平台、云平台配合。 Prometheus 作为新一代的云原生监控系统,目前已经有超过 650+ 位贡献者参与到 Prometheus 的研发工作上,并且超过 120+ 项的第三方集成。
五、Prometheus 时序数据
时序数据,是在一段时间内通过重复测量(measurement)而获得的观测值的集合将这些观测值绘制于图形之上,它会有一个数据轴和一个时间轴,服务器指标数据、应用程序性能监控数据、网络数据等也都是时序数据。
- 数据来源:
prometheus 基于 HTTP call (http/https 请求),从配置文件中指定的网络端点 endpoint/IP:端口 上周期性获取指标数据。很多环境、被监控对象,本身是没有直接响应/处理 http 请求的功能,prometheus-exporter 则可以在被监控端收集所需的数据,收集过来之后,还会做标准化,把这些数据转化为 prometheus 可识别,可使用的数据。
- 收集数据:
监控概念:白盒监控、黑盒监控
白盒监控:自省方式,被监控端内部,可以自己生成指标,只要等待监控系统来采集时提供出去即可。
黑盒监控:对于被监控系统没有侵入性,对其没有直接 “影响”,这种类似于基于探针机制进行监控(snmp 协议)。
Prometheus 支持通过三种类型的途径从目标上 "抓取(Scrape)" 指标数据(基于白盒监控)
Exporters -> 工作在被监控端,周期性的抓取数据并转换为 pro 兼容格式等待 prometheus 来收集,自己并不推送。
Instrumentation -> 指被监控对象内部自身有数据收集、监控的功能,只需要 prometheus 直接去获取。
Pushgateway -> 短周期 5s-10s 的数据收集。
- 获取方式:
Prometheus 同其它 TSDB 相比有一个非常典型的特性,它主动从各 Target 上拉取数据,而非等待被监控端的推迭。(pull/push)
两个获取方式各有优劣,其中,Pull 模型的优势在于:
集中控制:有利于将配置集在 Prometheus server 上完成,包括指标及采取速率等。Prometheus 的根本目标在于收集在 target 上预先完成聚合的聚合型数据,而非一款由事件驱动的存储系统通过 targets(标识的是具体的被监控端)。
比如配置文件中的 targets:['localhost:9090']
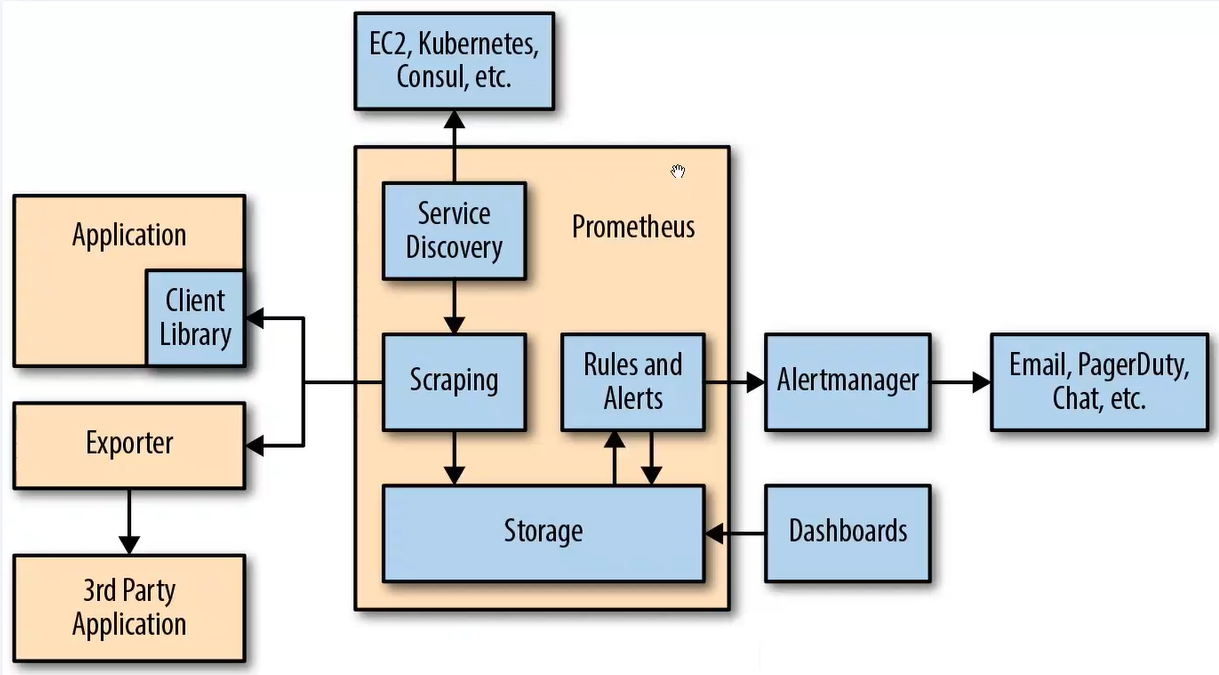
六、Prometheus 生态组件
prometheus 生态圈中包含了多个组件,其中部分组件可选。
- Prometheus server:收集和储存时间序列数据。通过 scraping 以刮擦的方式去获取数据放入 storge(TSDB 时序数据库),制定 Rules/Alerts 告警规则,service discovery 自动发现需要监控的节点。
- Client Library:客户端库,目的在于为那些期望原生提供 Instrumentation 功能的应用程序提供便捷的开发途径。
- Push Gateway:接收那些通常由短期作业生成的指标数据的网关,并支持由 Prometheus Server 进行指标拉取操作。
- Exporters:用于暴露现有应用程序或服务(不支持 Instrumentation)的指标给 Prometheus server。
而 pro 内建了数据样本采集器,可以通过配置文件定义,告诉 prometheus 到那个监控对象中采集指标数据,prometheus 采集过后,会存储在自己内建的 TSDB 数据库中,提供了 PromQL 支持查询和过滤操作,同时支持自定义规则来作为告警规则,持续分析一场指标,一旦发生,通知给 alerter 来发送告警信息,还支持对接外置的 UI 工具( grafana)来展示数据。采集、抓取数据是其自身的功能,但一般被抓取的数据一般来自于:export/instrumentation (指标数据暴露器)来完成的,或者是应用程序自身内建的测量系统(汽车仪表盘之类的,测量、展示)。
-
Alertmanager:prometheus 可以生成告警信息,但是不能直接提供告警,需要使用一个外置的组件 altermanager 来进行告警。由告警规则对接,从 Prometheus Server 接收到 “告警通知” 后,通过去重、分组、路由等预处理功能后高效向用户完成告警信息发送。emailetcd 优势在于
收敛、支持静默、去重、可以防止告警信息的轰炸。 -
Data Visualization(Dashboards):与 TSDB 对接并且展示数据库中的数据,Prometheus web UI(Prometheus Server 内建),及 Grafana 等。
-
Service Discovery:动态发现待监控的 Target,从而完成监控配置的重要组件,在容器化环境中尤为有用。该组件目前由 PrometheusServer 内建支持。
-
PromQL(告警规则编写):通常告警规则的文件指定输出到展示界面(grafana)
-
UI 表达式浏览器(调试)

七、Prometheus 数据模型
1. 概述
-
Prometheus 仅用键值方式存储时序式的聚合数据,不支持文本信息
-
其中的 “键” 称为指标(metric),通常意味着 CPU 速率、内存使用率或分区空闲比例等
-
同一指标可能适配到多个目标或设备、因而它使用 “标签” 作为元数据,从而为 metric 添加更多的信息描述维度
-
Prometheus 每一份样本数据都包含了:
① 时序列标识:key+lables
② 当前时间序列的样本值value
③ 这些标签可以作为过滤器进行指标过滤及聚合运算,如何从上万的数据过滤出关键有限的时间序列,同时从有限的时间序列在特定范围的样本那就需要手动编写出时间序列的样本表达式来过滤出我们想要的样本数据
2. 指标类型
默认都是双精度浮点型数据(服务器端无数据量类型数据)
- counter:计数器单调递增
- gauge:仪表盘:有起伏特征的
- histogram:直方图
在一段时间范围内对数据采样的相关结果,并记入配置的 bucket 中,它可以存储更多的数据,包括样本值分布在每个 bucket 的数量,从而 prometheus 就可以使用内置函数进行计算。
计算样本平均值:以值得综合除以值的数量
计算样本分位值:分位数有助于了解符合特定标准的数据个数,例如评估响应时间超过1秒的请求比例,若超过20侧则进行告警等
- summary:摘要,histogram 的扩展类型,它是直接由监控端自行聚合计算出分位数,同时将计算结果响应给 prometheus server 的样本采集请求,因而,其分位数计算是由监控端完成
3. 作业 job 和实列 targets/instance
- job:能够接收 prometheus server 数据 scrape ,如
"mysql nodes" "mysql master slave" - targets:每一个可以被监控的系统,成为 targets 多个相同的 targets 的集合(类)称为 job
- instance:实例与 targets 类似。与 target 相比,instance 更趋近于一个具体可以提供监控数据的实例,而 targets 则更像一个对象、目标性质。
4. PrometheusQL(数据查询语言也是时序数据库使用语言)
支持两种向量,同时内置提供了一组用于数据处理的函数
- 即时向量:最近以此时间戳上跟踪的数据指标,表示的是一个时间刻度
- 即时向量选择器:返回0个1个或者多个时间序列上在给定时间戳上的各自的一个样本,该样本成为即时样本
- 时间范围向量:指定时间范围内所有时间戳上的数据指标,表示的是一组时间区间
- 范围向量选择器:返回0个1个或多个时间序列上在给定时间范围内的各自的一组样本(范围向量选择器无法用于绘图)
八、Prometheus 安装
[root@c7-1 ~]#hostnamectl set-hostname prometheus
[root@c7-1 ~]#su
[root@prometheus ~]#systemctl stop firewalld && systemctl disable firewalld &> /dev/null
[root@prometheus ~]#setenforce 0
[root@prometheus ~]#ntpdate ntp1.aliyun.com &> /dev/null
[root@prometheus ~]#wget http://101.34.22.188/prometheus/prometheus-2.27.1.linux-amd64.tar.gz -P /opt &> /dev/null
[root@prometheus ~]#tar xf /opt/prometheus-2.27.1.linux-amd64.tar.gz -C /usr/local/
[root@prometheus ~]#cd /usr/local/prometheus-2.27.1.linux-amd64/
[root@prometheus /usr/local/prometheus-2.27.1.linux-amd64]#ls
console_libraries  consoles  LICENSE  NOTICE  prometheus  prometheus.yml  promtool
主配置文件
[root@prometheus /usr/local/prometheus-2.27.1.linux-amd64]#egrep -v "^(.)*#(.)*$" prometheus.yml | grep -v "^$"
global:
alerting:
  alertmanagers:
  - static_configs:
    - targets:
rule_files:
scrape_configs:
  - job_name: 'prometheus'
    static_configs:
    - targets: ['localhost:9090']

[root@prometheus /usr/local/prometheus-2.27.1.linux-amd64]#cat prometheus.yml
# my global config
global:		#全局组件
  scrape_interval:     15s # Set the scrape interval to every 15 seconds. Default is every 1 minute.
  evaluation_interval: 15s # Evaluate rules every 15 seconds. The default is every 1 minute.
  # scrape_timeout is set to the global default (10s).

# Alertmanager configuration	#对接的 altermanager (第三方告警模块)
alerting:
  alertmanagers:
  - static_configs:
    - targets:
      # - alertmanager:9093

# Load rules once and periodically evaluate them according to the global 'evaluation_interval'.
rule_files:		#告警规则;告警规则可以使用 yml 规则去书写
  # - "first_rules.yml"
  # - "second_rules.yml"

# A scrape configuration containing exactly one endpoint to scrape:
# Here it's Prometheus itself.
scrape_configs:		#数据采集模块
  # The job name is added as a label `job=<job_name>` to any timeseries scraped from this config.		#对于所抓取的指标数据采集的来源在job_name中定义
  - job_name: 'prometheus'		#对于指标需要打上的标签,对于PrometheusSQL(查询语句)的标签:比如prometheus{target='values'}

    # metrics_path defaults to '/metrics'	#收集数据的路径,展示使用 metrics 模式
    # scheme defaults to 'http'.			#默认抓取的方式是 http

    static_configs:		#对于 Prometheus 的静态配置监听端口具体数据收集的位置 默认的端口 9090
    - targets: ['localhost:9090']
开启 prometheus
[root@prometheus /usr/local/prometheus-2.27.1.linux-amd64]#nohup ./prometheus &
[1] 65782
[root@prometheus /usr/local/prometheus-2.27.1.linux-amd64]#nohup: 忽略输入并把输出追加到"nohup.out"
#启动慢,等一会
[root@prometheus /usr/local/prometheus-2.27.1.linux-amd64]#netstat -antp | grep 9090
tcp6       0      0 :::9090                 :::*                    LISTEN      65782/./prometheus
tcp6       0      0 ::1:9090                ::1:58132               ESTABLISHED 65782/./prometheus
tcp6       0      0 ::1:58132               ::1:9090                ESTABLISHED 65782/./prometheus
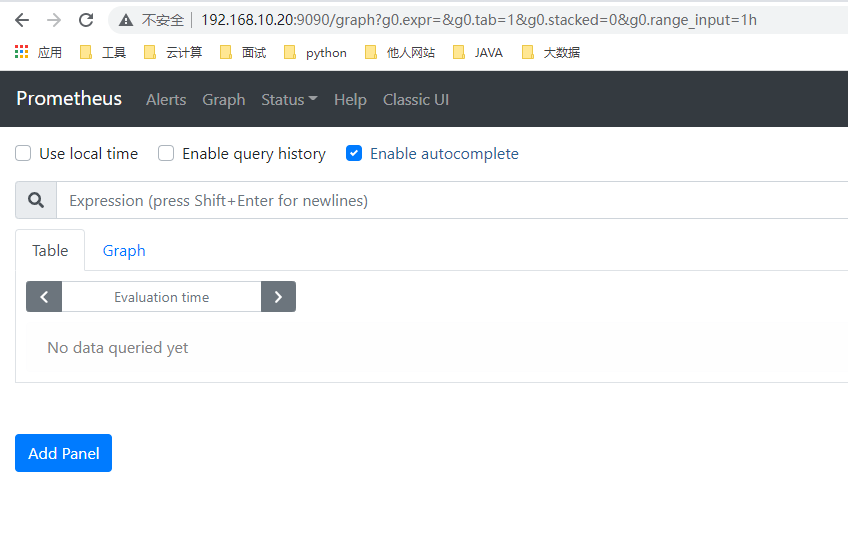
访问 web 页面(prometheus 是表达式浏览器)
Prometheus 会周期性的采集数据,多次周期性采集的数据集合形成时间序列
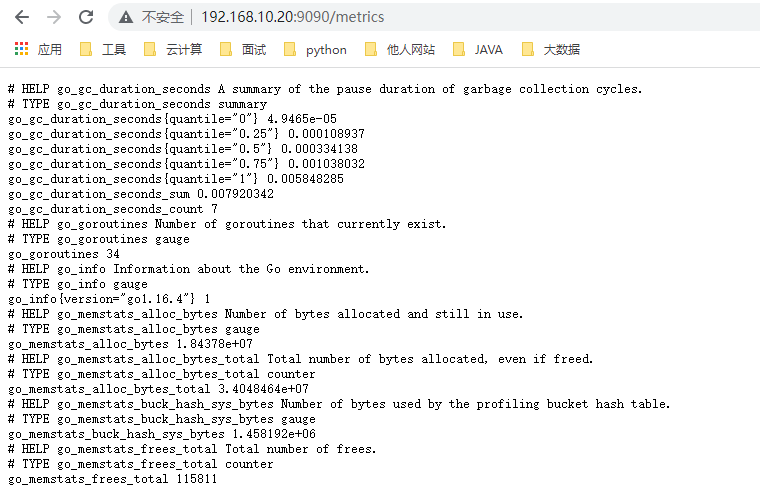
访问 192.168.10.20:9090/metrics ,查看 prometheus 自带的内键指标
九、Prometheus 监控其他节点
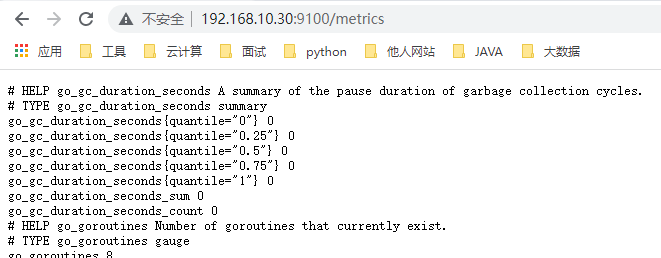
在 Prometheus 的架构设计中,Prometheus Server 并不直接服务监控特定的目标,其主要任务负责数据的收集,存储并且对外提供数据查询支持。因此为了能够监控到更多信息,如主机的 CPU 使用率等,我们需要使用到 node_exporter。Prometheus 周期性的从 Exporter 暴露的 HTTP 服务地址(通常是 /metrics)拉取监控样本数据。
下载地址: http://prometheus.io/download/
或者
wget http://101.34.22.188/prometheus/node_exporter-1.1.2.linux-amd64.tar.gz
解压安装包,优化命令路径,设置服务控制,开启服务(被监控端)
tar zxvf node_exporter-1.1.2.linux-amd64.tar.gz
cd node_exporter-1.1.2.linux-amd64
cp node_exporter /usr/local/bin
./node_exporter --help		#查看命令可选项
服务开启方式一:直接运行
./node_exporter
服务开启方式二:使用 systemctl 控制
cat /usr/lib/systemd/system/node_exporter.service
[Unit]
Description=node_exporter
Documentation=https://prometheus.io/
After=network.targets

[service]
Type=simple
User=prometheus
ExecStart=/usr/local/bin/node_exporter \
--collector.ntp \
--collector.mountstats \
--collector.systemd l
--collertor.tcpstat
ExecReload=/bin/kill -HUP $MAINPID
TimeoutStopSec=20s
Restart=always

[Install]
WantedBy=multi-user.target

-------------------------
systemctl daemon-reload
systemctl start node_exporter
启动成功后,可以看到以下输出:
......
level=info ts=2021-12-09T14:48:10.414Z caller=tls_config.go:191 msg="TLS is disabled." http2=false
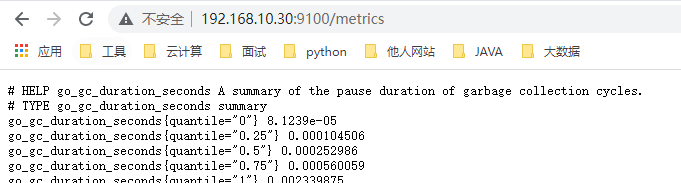
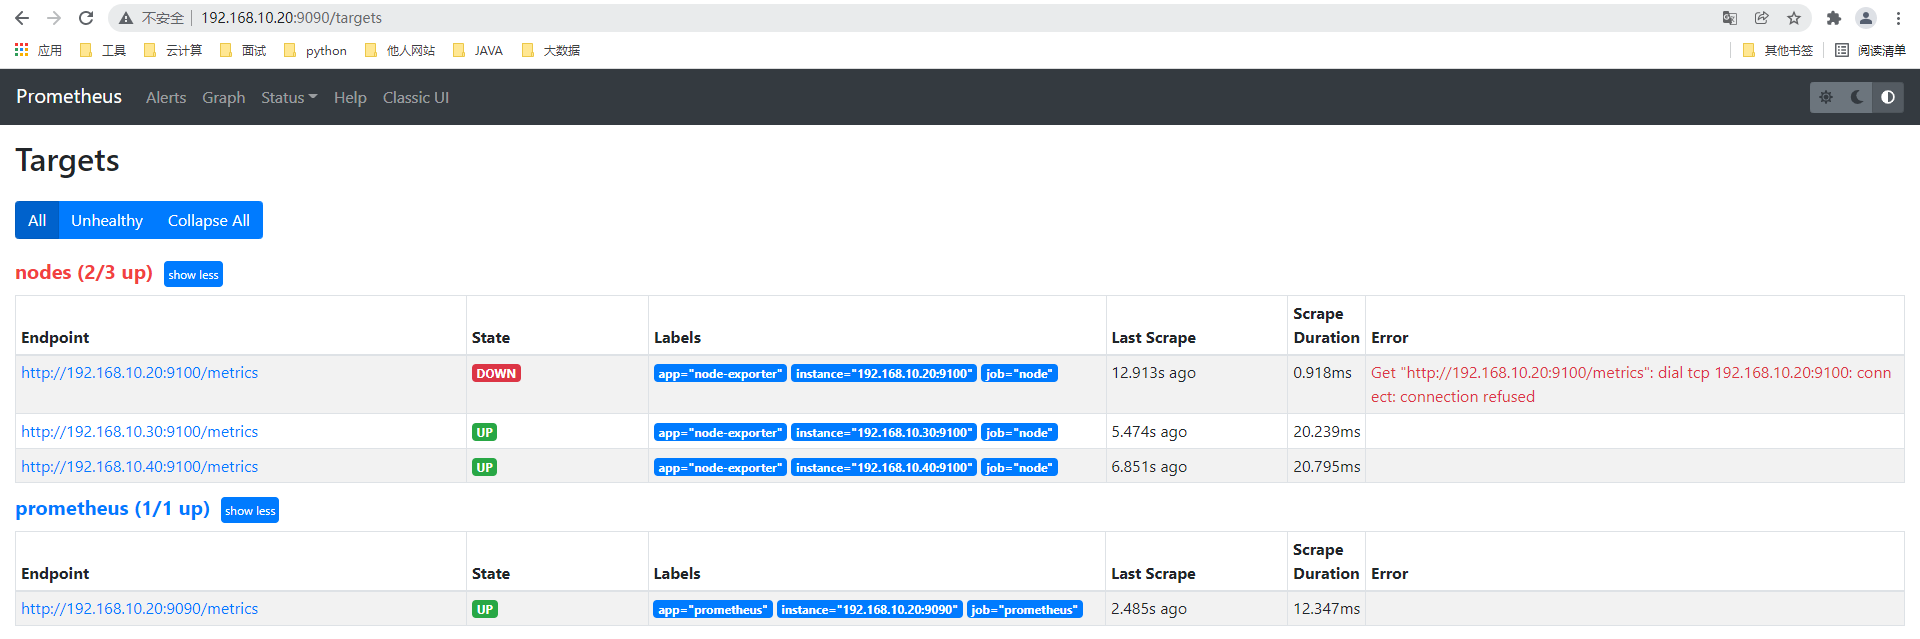
访问 192.168.10.30:9100/metrics (node 节点)查看抓取内容
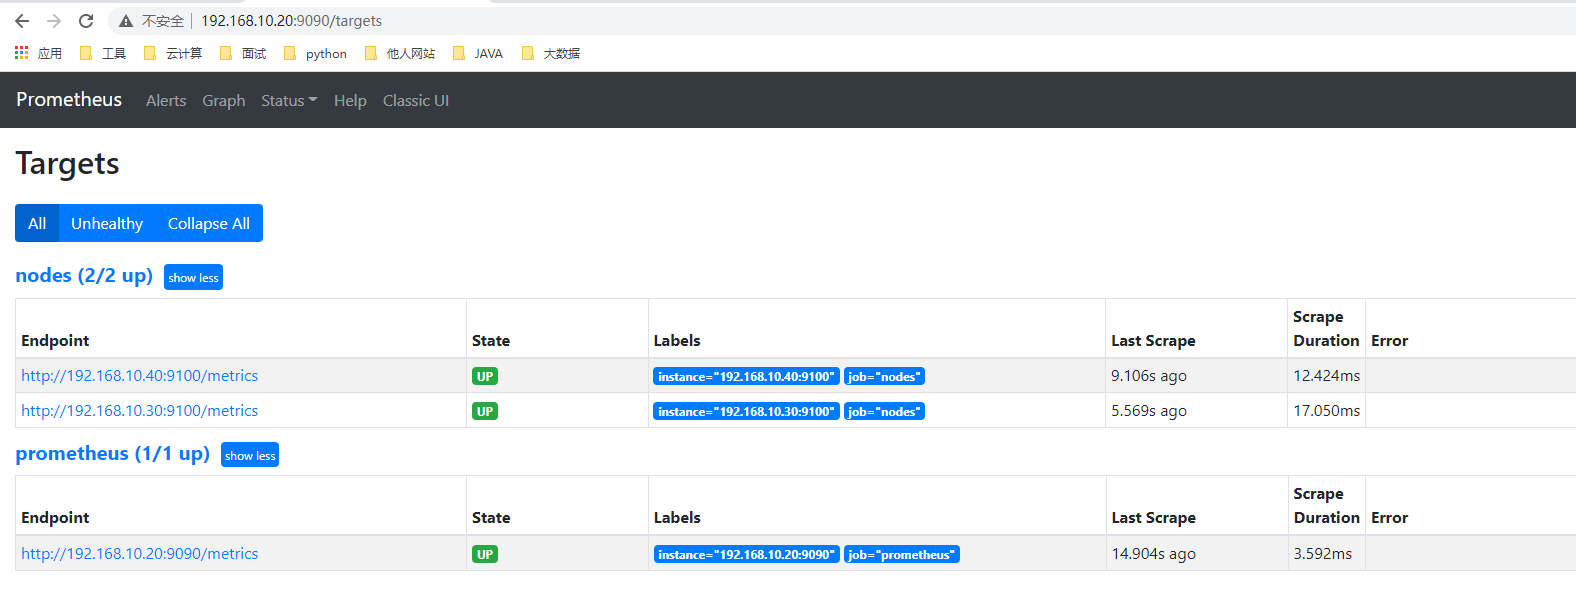
访问 http://192.168.10.20:9090/ (服务端)点击 -》status -》targets,发现并没有 node 指标,那是因为我们还没配 prometheus.yml 文件
[root@prometheus /usr/local/prometheus-2.27.1.linux-amd64]#vim prometheus.yml
......
......
#添加如下配置,有几个节点就加几个节点(我们并没有在 20 上安装 node_exporter,因此实验应该收集不到 20 的指标)
  - job_name: 'nodes'
    static_configs:
    - targets:
      - 192.168.10.20:9100
      - 192.168.10.30:9100
      - 192.168.10.40:9100

重启服务端 prometheus 查看监控情况
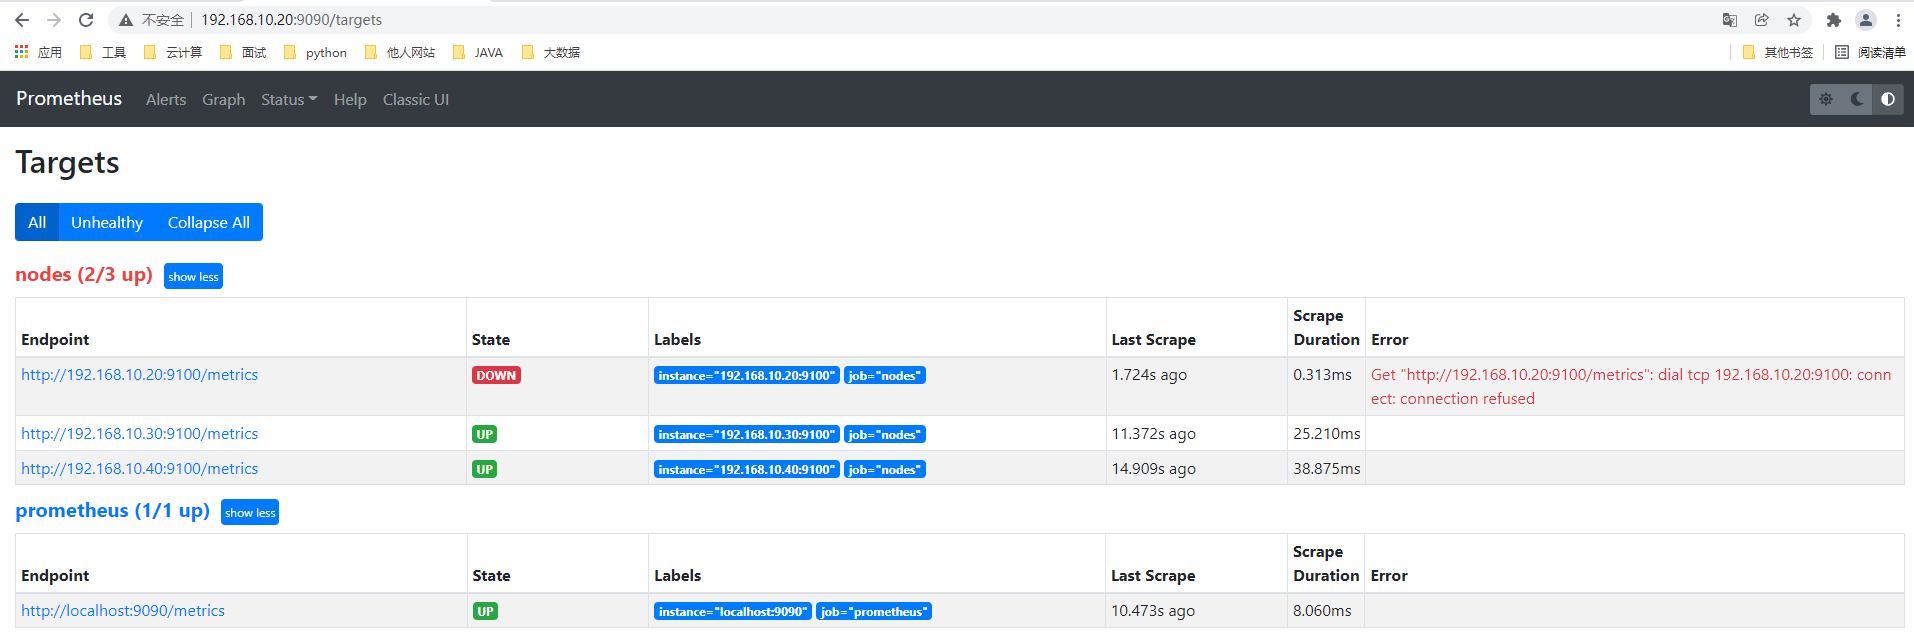
可以看到安装了 node_exporter 的 30/40 可以监控,20 无法连接。当然也可以查看被监控端展示的数据。
输入 up 函数查看当前在线的主机,0 值表示异常
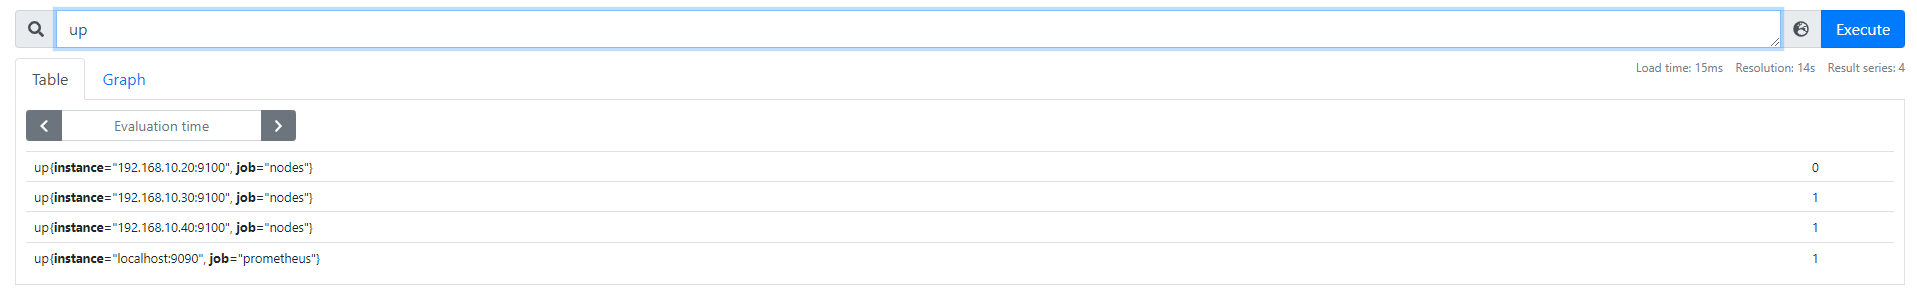
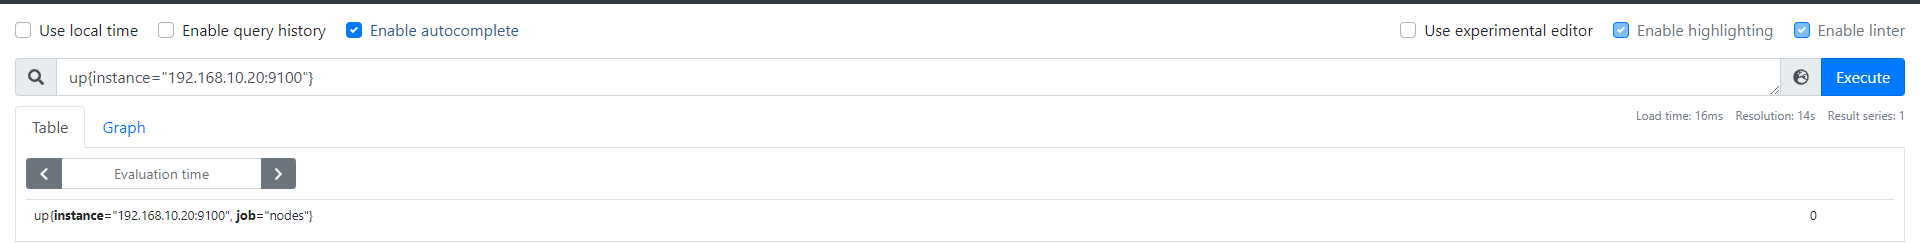
筛选:
up{job=“prometheus”}
up{instance=“192.168.10.20:9100”}
十、表达式浏览器常规使用
CPU 使用总量
PromQL:
node_cpu_seconds_total
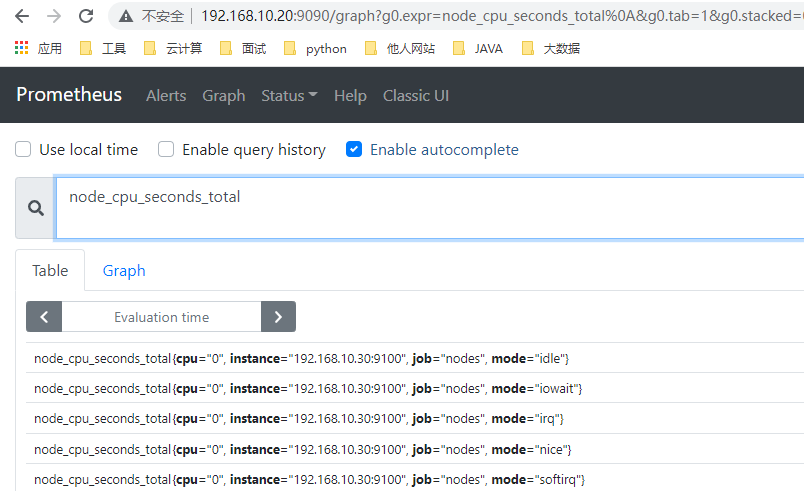
计算过去 5 分钟内 CPU 使用速率
irate(node_cpu_seconds_total{mode="idle"}[5m])
-----------------------------------------------
irate : 速率计算函数(灵敏度非常高的)
node_cpu_seconds_total : node节点CPU使用总量
mode="idle" : 空闲指标
5m : 过去的5分钟内,所有CPU空闲数的样本值,每个数值做速率运算
每台主机 CPU 在 5 分钟内的平均使用率
(1-avg(irate(node_cpu_seconds_total{mode='idle'}[5m]))by (instance))*100
---------------------------------------------------------
avg : 平均值
avg(irate(node_cpu_seconds_total{mode='idle'}[5m]) : 可以理解为 CPU 空闲量的百分比
by(instance) : 表示的是所有节点

查询 1 分钟平均负载超过主机 CPU 数量两倍的时间序列
node_load1 > on (instance) 2 * count (node_cpu_seconds_total{mode='idle'}) by(instance)
内存使用率
node_memory_MemTotal_bytes
node_memory_MemFree_bytes
node_memory_Buffers_bytes
node_memory_Cached_bytes

#计算使用率:
可用空间:以上后三个指标之和
己用空间:总空间减去可用空间
使用率:己用空间除以总空间
阶段总结
指标(配置文件/PromQL):target/instance
target 偏向于表示一个集合
instance 偏向于表示具体的一个可提供监控数据的对象

PromQL:指标 {标签1=标签值1,......,标签N=标签N} 样本(值)

prometheus 的配置文件:
- global
- alertmanager
- rules
- scrape

prometheus 架构模型(工作流程)

scrape 收集数据方式:
- exporter
- 自建/内建指标
- pushgateway

sd 服务发现:
- 基于 fd 文件
- 基于 DNS -》SRV 记录
- 基于 consul -》自动发现,同时利用 prometheus 的自身周期扫描配置文件更新并且加载的特性,实现动态更新
- 基于 K8S 服务发现
十一、部署 Service Discovery 服务发现
1. 相关概念
1.1 Prometheus 指标抓取的生命周期
发现 -> 配置 -> relabel -> 指标数据抓取 -> metrics relabel
Prometheus 的服务发现类型:
-
基于文件的服务发现
-
基于 DNS 的服务发现
-
基于 API 的服务发现:Kubernetes、Consul、Azure、重新标记;target 重新打标;metric 重新打标
-
基于 K8S 的服务发现
1.2 Prometheus 的服务发现机制
详细的 Prometheus 工作生命周期
- Prometheus Server 的数据抓取工作于 Pull 模型,因而它必需要事先知道各 Target 的位置,然后才能从相应的 Exporter 或 Instrumentation 中抓取数据。
- 对于小型的系统环境来说,通过 static_configs 指定各 Target 便能解决问题,这也是最简单的配置方法。每个 Targets 用一个网络端点
ip:port进行标识。 - 对于中大型的系统环境或具有较强动态性的云计算环境来说,静态配置显然难以适用。
因此,Prometheus 为此专门设计了一组服务发现机制,以便于能够基于服务注册中心(服务总线)自动发现、检测、分类可被监控的各 Target,以及更新发生了变动的 Target 指标抓取的生命周期。 - 在每个 scrape_interval 期间,Prometheus 都会检查执行的作业 Job,这些作业首先会根据 Job 上指定的发现配置生成 Target 列表,此即服务发现过程。服务发现会返回一个 Target 列表,其中包含一组称为元数据的标签,这些标签都以
meta_为前缀。 - 服务发现还会根据目标配置来设置其它标签,这些标签带有 “” 前缀和后缀,包括 “scheme”、“address” 和 “metrics path_”,分别保存有 target 支持使用协议(http或https,默认为http) 、target 的地址及指标的 URI 路径(默认为 /metrics)。
- 若 URI 路径中存在任何参数,则它们的前缀会设置为 “param” 这些目标列表和标签会返回给 Prometheus,其中的一些标签也可以配置中被覆盖。
- 配置标签会在抓取的生命周期中被重复利用以生成其他标签,例如指标上的 instance 标签的默认值就来自于 address 标签的值。
- 对于发现的各目标,Prometheus 提供了可以重新标记(relabel)目标的机会,它定义在 job 配置段的 relabel_config 配置中。
2. 静态配置发现
修改 prometheus 服务器上的配置文件,指定 targets 的端口
- job_name: 'nodes'
  static_config:
  - targets:
    - 192.168.10.20:9100
    - 192.168.10.30:9100
    - 192.168.10.40:9100
3. 动态发现
3.1 基于文件形式的服务发现
-
基于文件的服务发现仅仅略优于静态配置的服务发现方式,它不依赖于任何平台或第三方服务,因而也是最为简单和通用的实现方式。
-
prometheus server 定期从文件中加载 target 信息(pro-server pull 指标发现机制 -job_name 获取我要 pull 的对象target)文件可以只用 json 和 yaml 格式,它含有定义的 target 列表,以及可选的标签信息
-
以下第一配置,能够将 prometheus 默认的静态配置转换为基于文件的服务发现时所需的配置
prometheus 会周期性的读取、重载此文件中的配置,从而达到动态发现、更新的操作
环境准备
cd /usr/local/prometheus-2.27.1.linux-amd64/
mkdir file_sd
cd file_sd
mkdir targets
#把修改后的 Prometheus.yml 上传到 file_sd 目录下
cd targets
#把 nodes_centos.yaml、prometheus_server.yaml、prometheus.yml 上传到指定目录下
wget http://101.34.22.188/prometheus/file_sd/nodes_centos.yaml -P /usr/local/prometheus-2.27.1.linux-amd64/file_sd/targets
wget http://101.34.22.188/prometheus/file_sd/prometheus_server.yaml -P /usr/local/prometheus-2.27.1.linux-amd64/file_sd/targets
wget http://101.34.22.188/prometheus/file_sd/prometheus.yml -P /usr/local/prometheus-2.27.1.linux-amd64/file_sd

-----------------------------
[root@prometheus /usr/local/prometheus-2.27.1.linux-amd64/file_sd]#tree
.
├── prometheus.yml
└── targets
    ├── nodes_centos.yaml
    └── prometheus_server.yaml

1 directory, 3 files
修改 nodes_centos.yaml、prometheus_server.yaml 两个文件 IP 为自己的 IP
指定配置文件启动
[root@prometheus /usr/local/prometheus-2.27.1.linux-amd64]#ps aux|grep prometheus
root       3999  0.1  2.8 1242744 109004 ?      Sl   07:03   0:30 ./prometheus
root      63514  0.0  0.0 112728   980 pts/1    S+   11:33   0:00 grep --color=auto prometheus
[root@prometheus /usr/local/prometheus-2.27.1.linux-amd64]#kill -9 3999
[root@prometheus /usr/local/prometheus-2.27.1.linux-amd64]#ps aux|grep prometheus
root      63525  0.0  0.0 112728   976 pts/1    S+   11:33   0:00 grep --color=auto prometheus
[root@prometheus /usr/local/prometheus-2.27.1.linux-amd64]#./prometheus --config.file=./file_sd/prometheus.yml
......
......
开启 node 节点
./node_exporter
浏览器登录查看 http://192.168.10.20:9090/targets
新加一个节点安装 node_exporter ,在服务端 nodes_centos.yaml 添加一个节点信息,并查看这个节点信息是否加入

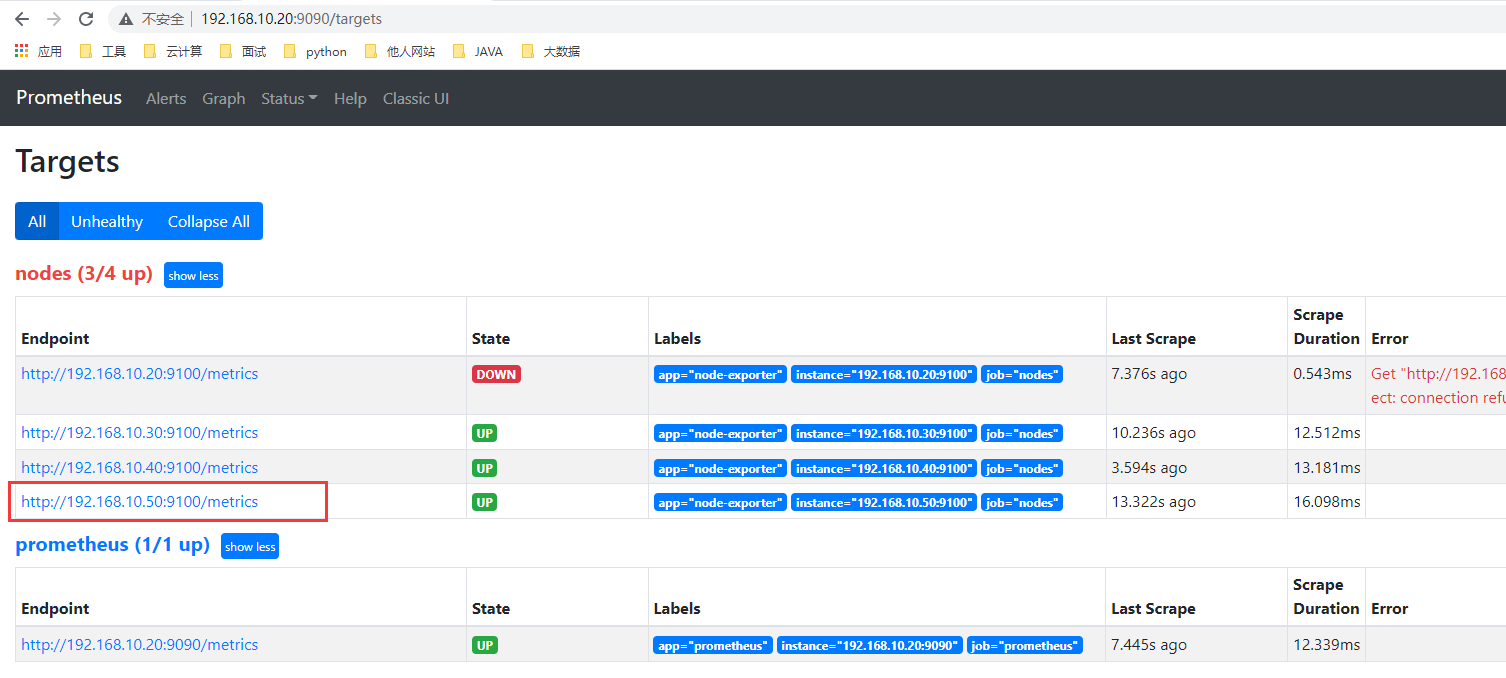
3.2 文件发现的作用
增加 node,prometheus 服务端节点只需更改 nodes_centos.yaml,prometheus_server.yaml 两个文件添加地址就行,不需要停止服务。
4. 基于 DNS 自动发现
- 基于 DNS 的服务发现,针对一组 DNS 域名进行定期查询,以发现待监控的目标查询时使用的 DNS 服务器由 /etc/resolv.conf 文件指定。
- 该发现机制依赖于 A、AAAA 和 SRV 资源记录,且仅支持该类方法,尚不支持 RFC6763 中的高级 DNS 发现方式。
#SRV:SRV 记录的作用是指明某域名下提供的服务。
例:
http._tcp.example.com.SRV 10 5 80. www.example.com SRV 后面项目的含义:
10-优先级,类似MX记录
5-权重
80-端口
www.example.com - 实际提供服务的主机名。同时 SRV 可以指定在端口上对应哪个 service
#prometheus 基于 DNS 的服务中的 SRV 记录,让 prometheus 发现指定 target 上对应的端口对应的是 exporter 或 instrumentation
5. 基于 Consul 发现
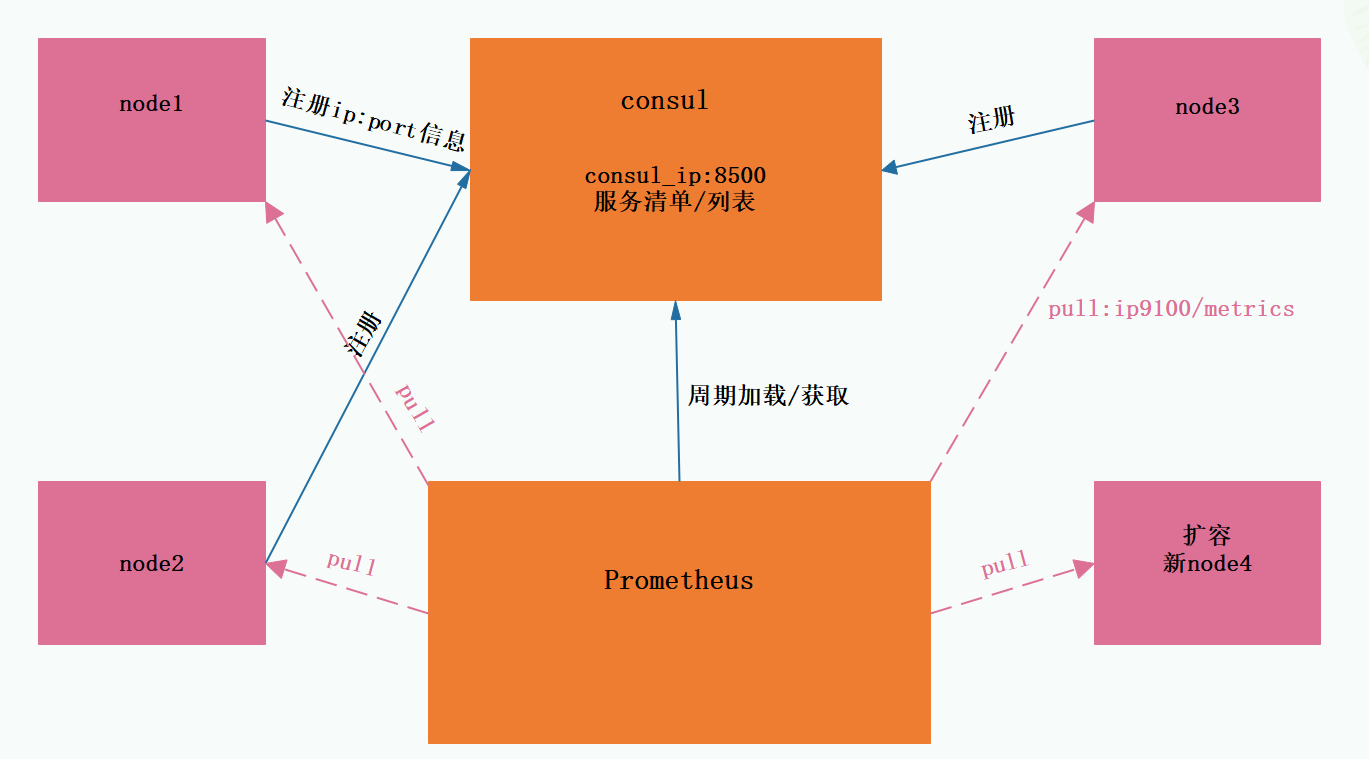
5.1 概述
一款基于 golang 开发的开源工具,主要面向分布式,服务化的系统。提供服务注册、服务发现和配置管理的功能。提供服务注册/发现、健康检查、Key/value 存储、多数据中心和分布式一致性保证等功能。
原理:
通过定义 json 文件将可以进行数据采集的服务注册到 consul 中,用于自动发现同时使用 prometheus 做为 client 端获取 consul 上注册的服务,从而进行获取数据
5.2 部署安装
prometheus 通过 consul 自动发现主机清单配置
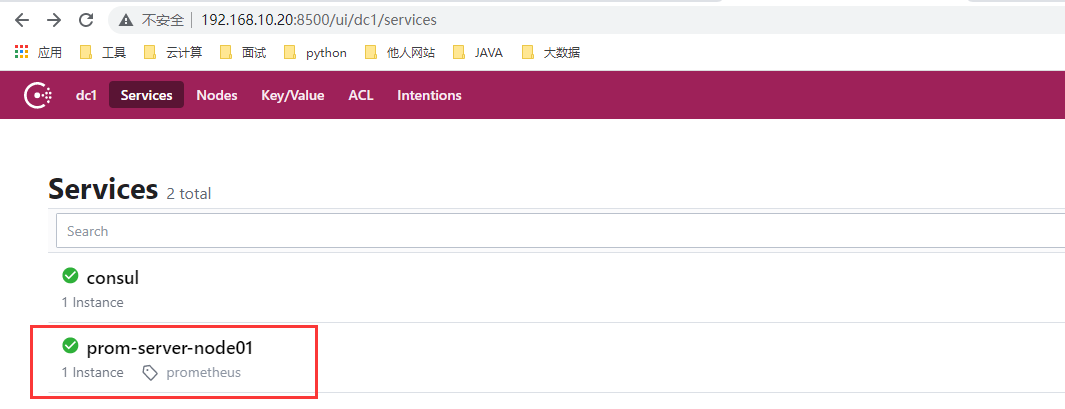
- 普罗米修斯的 prometheus-servers.json 文件中写的是它的主机信息,主机信息中写有相对应的标签 tags: “prometheus”,这个配置文件被 consul 所加载,加载后会显示在 8500 的端口上,prometheus 在 yml 文件中也定义了二个 job:“prometheus” “nodes”,关联了 consul 的位置 192.168.10.20:8500,Prometheus 会定期到 consul 8500 上去找标签是 prometheus 的节点,在 8500 上就可以获取主机信息,找到以后可以直接到 http://192.168.10.20:9090/metrics 上收集信息,最后通过 ui 表达式浏览器显示出来。
安装 consul_1.9.0 版本
[root@prometheus ~]#wget http://101.34.22.188/consul/consul_1.9.0_linux_amd64.zip &> /dev/null
[root@prometheus ~]#ls
consul_1.9.0_linux_amd64.zip
[root@prometheus ~]#unzip consul_1.9.0_linux_amd64.zip -d /usr/local/bin/
Archive:  consul_1.9.0_linux_amd64.zip
  inflating: /usr/local/bin/consul
启动开发者模式
consul 开发者模式,可以快速开启单节点的 consul 服务,具有完整功能,方便开发测试
[root@prometheus ~]#mkdir -pv /consul/data
mkdir: 已创建目录 "/consul"
mkdir: 已创建目录 "/consul/data"
[root@prometheus ~]#mkdir /etc/consul
[root@prometheus ~]#cd /etc/consul/
[root@prometheus /etc/consul]#consul agent -dev -ui -data-dir=/consul/data/ -config-dir=/etc/consul/ -client=0.0.0.0
......
#参数解析
consul agent 		#使用agent代理的方式来开启
-dev    			#开发者模式
-ui 				#启用ui界面
-data-dir 			#数据文件的位置
-config-dir 		#consul的配置文件位置
-client 			#监听的客户端为所有
编辑 /etc/consul 目录下的 prometheus-servers.json 配置文件
[root@prometheus ~]#vim /etc/consul/prometheus-servers.json

{
  "services": [
    {
      "id": "prometheus-server-node01",
      "name": "prom-server-node01",
      "address": "192.168.10.20",
      "port": 9090,
      "tags": ["prometheus"],
      "checks": [{
        "http": "http://192.168.10.20:9090/metrics",
        "interval": "5s"
      }]
    }
  ]
}

[root@prometheus ~]#consul reload
Configuration reload triggered
[root@prometheus ~]#netstat -antp |grep consul
tcp        0      0 127.0.0.1:8300          0.0.0.0:*               LISTEN      64781/consul
tcp        0      0 127.0.0.1:8301          0.0.0.0:*               LISTEN      64781/consul
tcp        0      0 127.0.0.1:8302          0.0.0.0:*               LISTEN      64781/consul
tcp        0      0 127.0.0.1:45987         127.0.0.1:8300          ESTABLISHED 64781/consul
tcp        0      0 127.0.0.1:8300          127.0.0.1:45987         ESTABLISHED 64781/consul
tcp6       0      0 :::8600                 :::*                    LISTEN      64781/consul
tcp6       0      0 :::8500                 :::*                    LISTEN      64781/consul
tcp6       0      0 :::8502                 :::*                    LISTEN      64781/consul
先终止 Prometheus 服务,修改配置文件
[root@prometheus ~]#ps aux|grep prometheus
root      63526  0.3  2.4 1114924 94196 pts/1   Sl+  12:10   0:22 ./prometheus --config.file=./file_sd/prometheus.yml
root      64823  0.0  0.0 112728   976 pts/2    S+   14:04   0:00 grep --color=auto prometheus
[root@prometheus ~]#kill -9 63526
[root@prometheus ~]#ps aux|grep prometheus
root      64826  0.0  0.0 112728   976 pts/2    S+   14:04   0:00 grep --color=auto prometheus
[root@prometheus ~]#cd /usr/local/prometheus-2.27.1.linux-amd64/
[root@prometheus /usr/local/prometheus-2.27.1.linux-amd64]#mkdir consul_sd
[root@prometheus /usr/local/prometheus-2.27.1.linux-amd64]#ls
console_libraries  consoles  consul_sd  data  file_sd  LICENSE  nohup.out  NOTICE  prometheus  prometheus.yml  promtool
[root@prometheus /usr/local/prometheus-2.27.1.linux-amd64]#cd consul_sd/
[root@prometheus /usr/local/prometheus-2.27.1.linux-amd64/consul_sd]#wget http://101.34.22.188/consul/prometheus/prometheus.yml
[root@prometheus /usr/local/prometheus-2.27.1.linux-amd64/consul_sd]#cat prometheus.yml
# my global config
# Author: MageEdu <mage@magedu.com>
# Repo: http://gitlab.magedu.com/MageEdu/prometheus-configs/
global:
  scrape_interval:     15s # Set the scrape interval to every 15 seconds. Default is every 1 minute.
  evaluation_interval: 15s # Evaluate rules every 15 seconds. The default is every 1 minute.
  # scrape_timeout is set to the global default (10s).

# Alertmanager configuration
alerting:
  alertmanagers:
  - static_configs:
    - targets:
      # - alertmanager:9093

# Load rules once and periodically evaluate them according to the global 'evaluation_interval'.
rule_files:
  # - "first_rules.yml"
  # - "second_rules.yml"

# A scrape configuration containing exactly one endpoint to scrape:
# Here it's Prometheus itself.
scrape_configs:
  # The job name is added as a label `job=<job_name>` to any timeseries scraped from this config.
  - job_name: 'prometheus'

    # metrics_path defaults to '/metrics'
    # scheme defaults to 'http'.

    consul_sd_configs:
    - server: "192.168.10.20:8500"
      tags:
      - "prometheus"
      refresh_interval: 2m

  # All nodes
  - job_name: 'nodes'
    consul_sd_configs:
    - server: "192.168.10.20:8500"
      tags:
      - "nodes"
      refresh_interval: 2m

#注意修改 IP
#指定配置文件位置运行 Prometheus,可以 nohup ... & 后台运行
[root@prometheus /usr/local/prometheus-2.27.1.linux-amd64]#./prometheus --config.file=./consul_sd/prometheus.yml
......
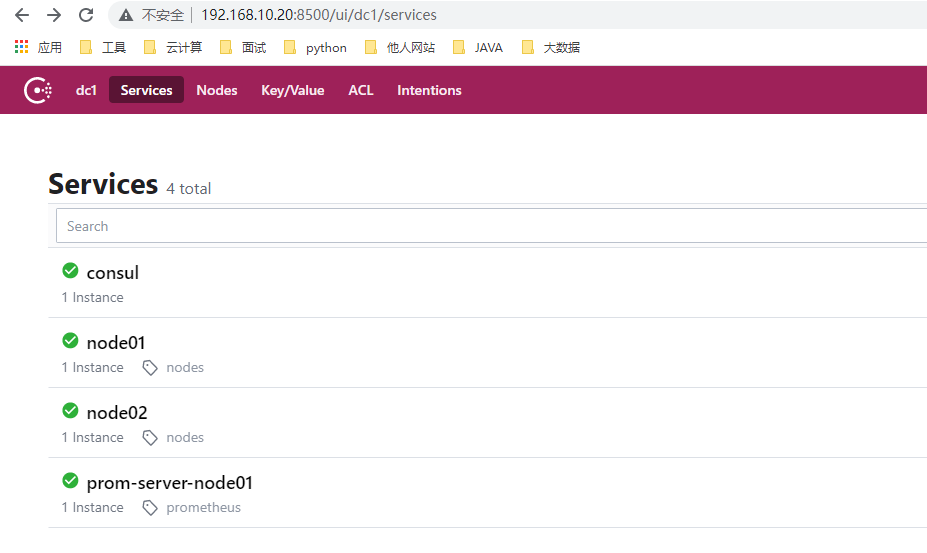
使用浏览器访问 http://192.168.10.20:8500 查看 node01 节点是否加入进去
添加 node 节点再查看
[root@prometheus /etc/consul]#wget http://101.34.22.188/consul/prometheus/nodes.json
......
[root@prometheus /etc/consul]#cat nodes.json
{
  "services": [
    {
      "id": "node_exporter-node01",
      "name": "node01",
      "address": "192.168.10.30",
      "port": 9100,
      "tags": ["nodes"],
      "checks": [{
        "http": "http://192.168.10.30:9100/metrics",
        "interval": "5s"
      }]
    },
    {
      "id": "node_exporter-node02",
      "name": "node02",
      "address": "192.168.10.40",
      "port": 9100,
      "tags": ["nodes"],
      "checks": [{
        "http": "http://192.168.10.40:9100/metrics",
        "interval": "5s"
      }]
    }
  ]
}

[root@prometheus /etc/consul]#consul reload
Configuration reload triggered
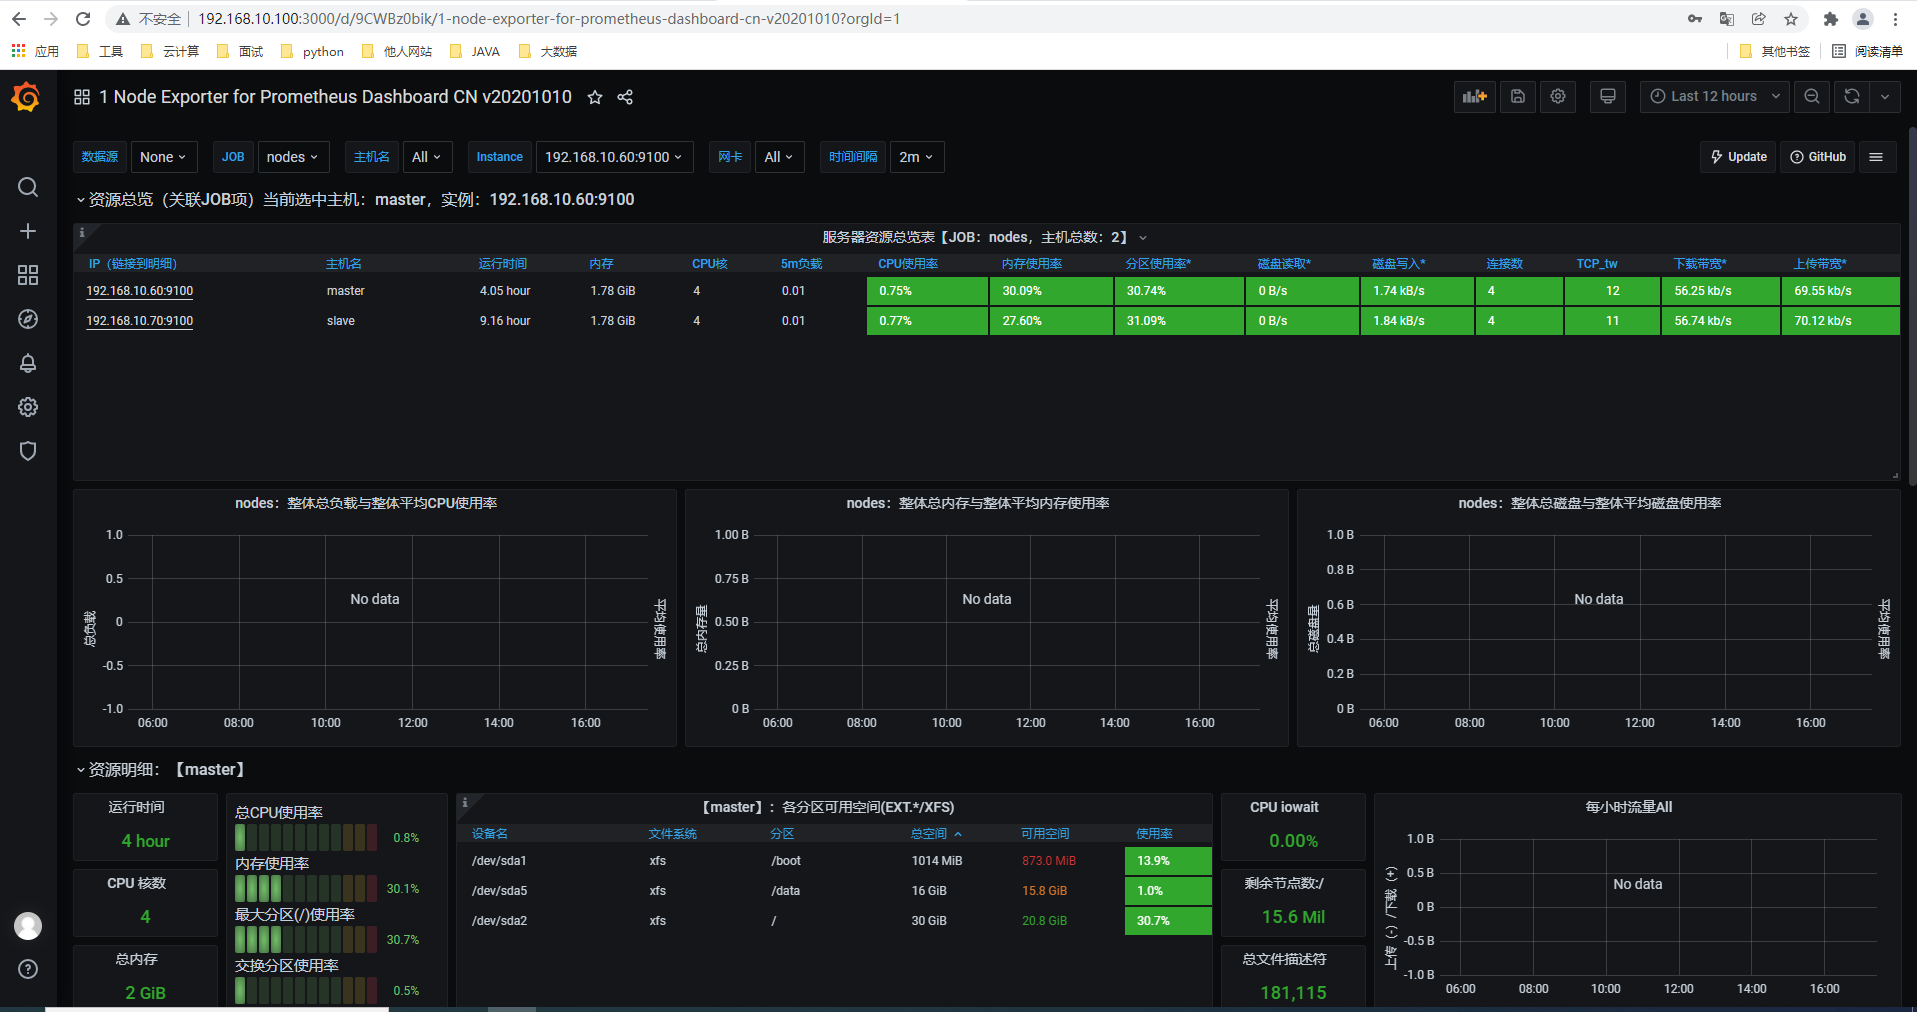
十二、Grafana 部署及模板展示
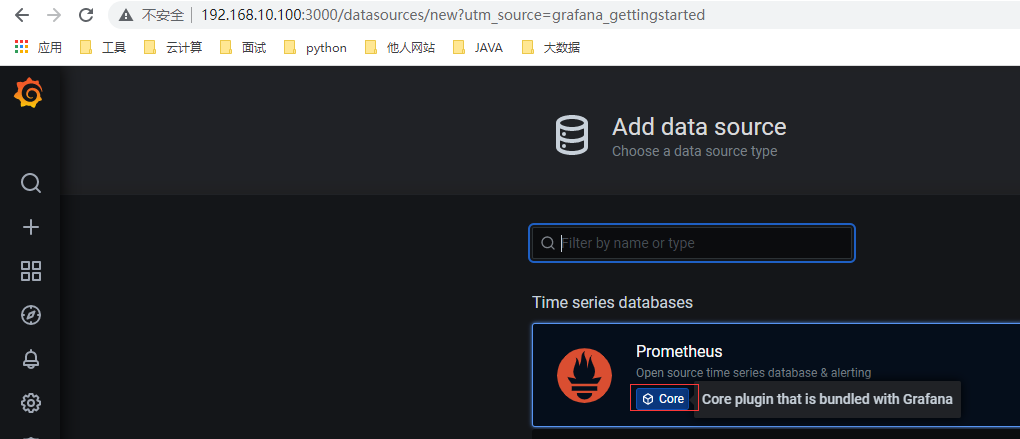
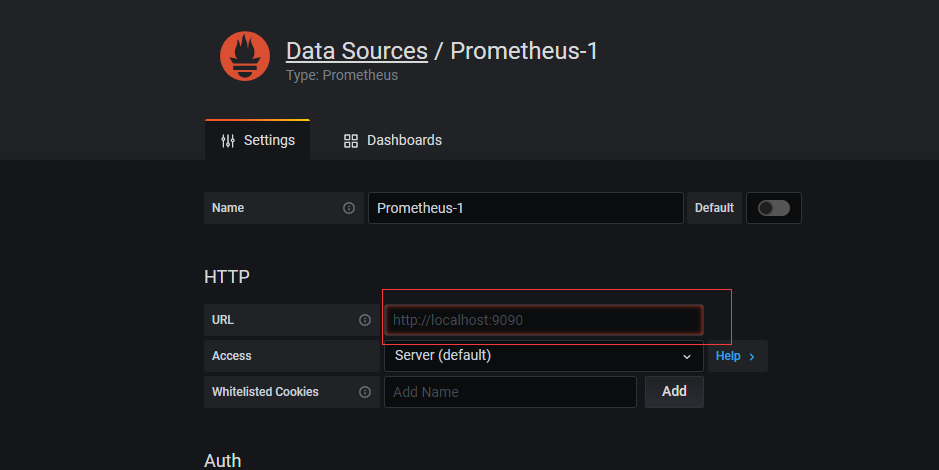
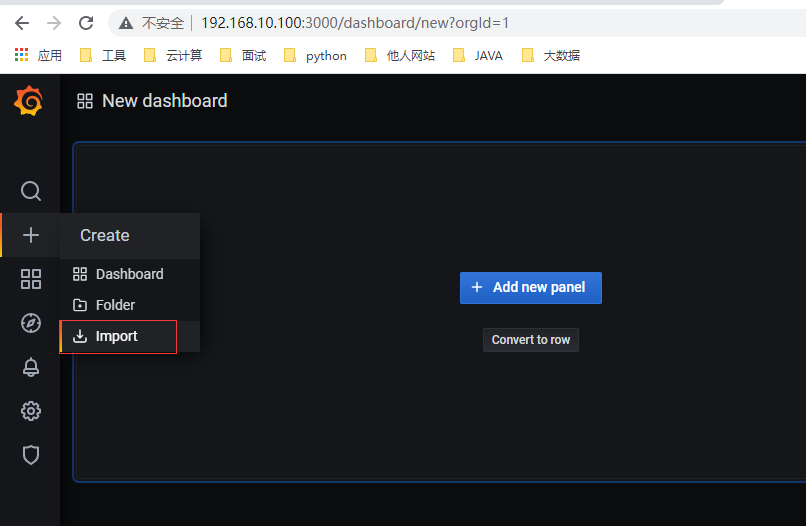
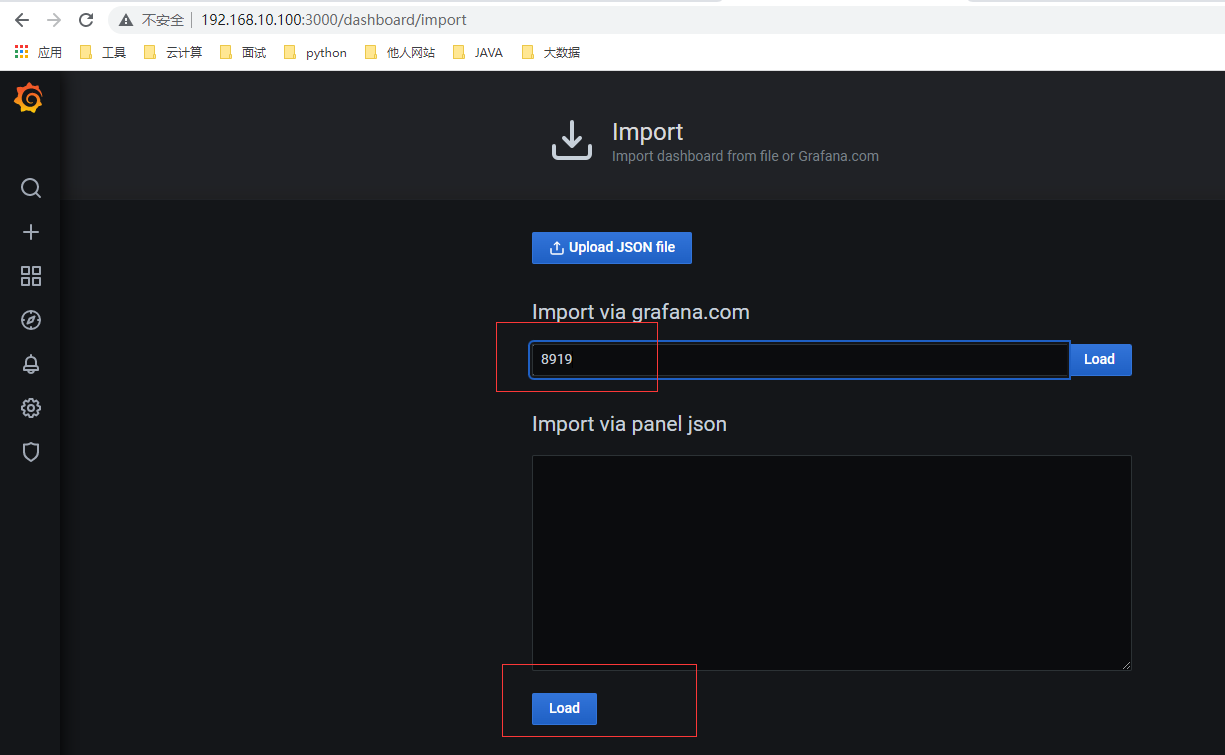
1. Grafana 概述
-
grafana 是一款基于 go 语言开发的通用可视化工具,支持从不同的数据源加载并展示数据,可作为其数据源的部分储存系统如下所示:
① TSDB:Prometheus、InfluxDB、OpenTSDB 和 Graphit
② 日志和文档存储:Loki 和 Elasticsearch
③ 分布式请求跟踪:Zipkin、Jaeger 和 Tenpo
④ SQLDB:MySQL、PostgreSQL 和 Microsoft SQL Server -
grafana 基础默认监听于 TCP 协议的 3000 端口,支持集成其他认证服务,且能够通过 /metrics 输出内建指标
-
支持的展示方式:
① 数据源(Data Source):提供用于展示数据的储存系统
② 仪表盘(Dashboard):组织和管理数据的可视化面板
③ 团队和用户:提供了面向企业组织层级的管理能力
2. 安装
wget http://101.34.22.188/grafana/grafana-7.3.6-1.x86_64.rpm
yum install -y grafana-7.3.6-1.x86_64.rpm
systemctl enable grafana-server	&& systemctl start grafana-server
netstat -nuptl|grep 3000
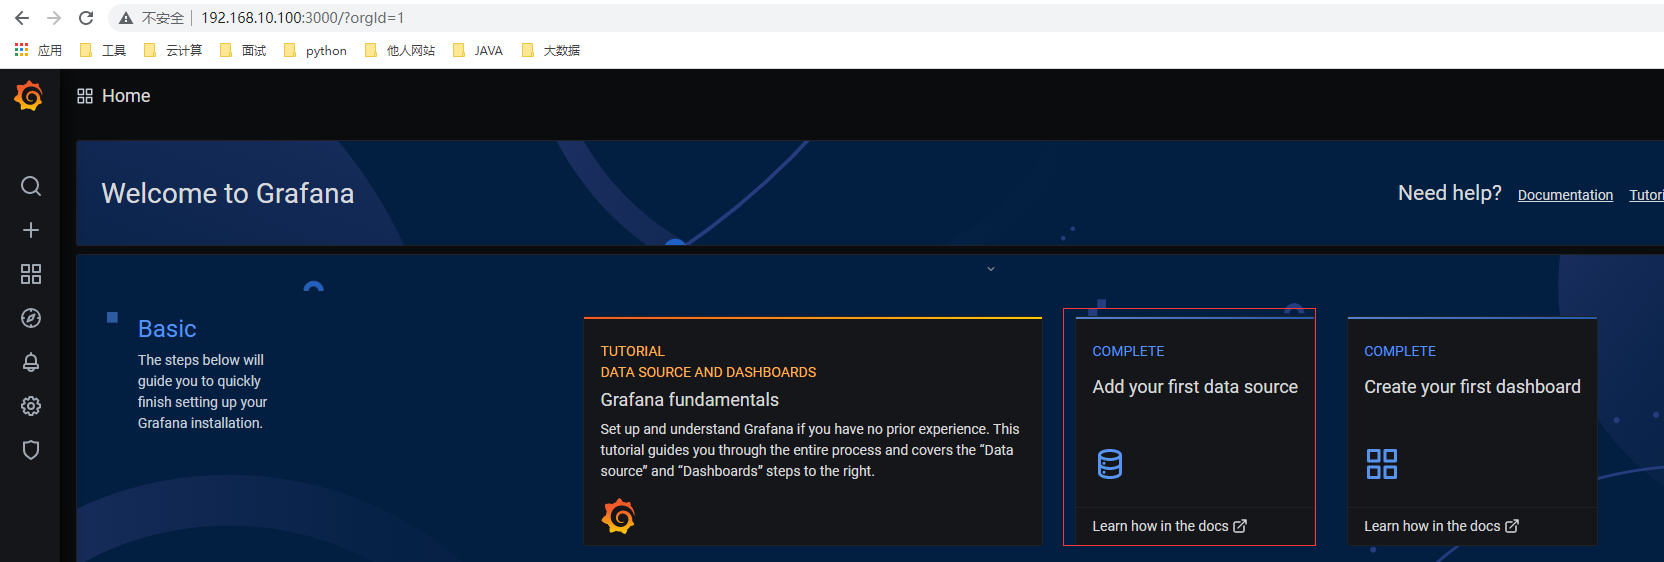
浏览器访问 http://IP:3000,默认账号密码:admin admin

为开发者提供学习成长、分享交流、生态实践、资源工具等服务,帮助开发者快速成长。
更多推荐


 8
8 0
0- 0


 已为社区贡献9条内容

所有评论(0)