如何查看yarn container日志 查看yarn任务所有container信息 yarn gc日志的查看和简单分析
如何使用命令行查看yarn日志和container信息及其日志,并进行简单的gc分析
·
查看yarn任务日志 任务运行中和结束时查看container的日志 GC日志的简单分析
文章目录
一、shell和yarn基础命令准备
1. 别名alias和错误输出重定向
$ alias lg='yarn logs -applicationId application_1652362266025_4019 $@ 2>/dev/null'
# 这样后面测试的时候就不用每次书写前年那固定的一长串了 -log_files <args> 等参数将填充至"$@"位置
# 2>/dev/null 错误日志重定向至黑洞,更方便查看结果
$ lg -log_files stdout | head
Container: container_e105_1652362266025_4019_01_000022 on ****-bg-w03_45454_1652490636096
LogAggregationType: AGGREGATED
=========================================================================================
LogType:stdout
LogLastModifiedTime:Sat May 14 09:10:36 +0800 2022
LogLength:6368
LogContents:
2022-05-14 08:11:37 Starting to run new task attempt: attempt_1652362266025_4019_1_10_000002_0
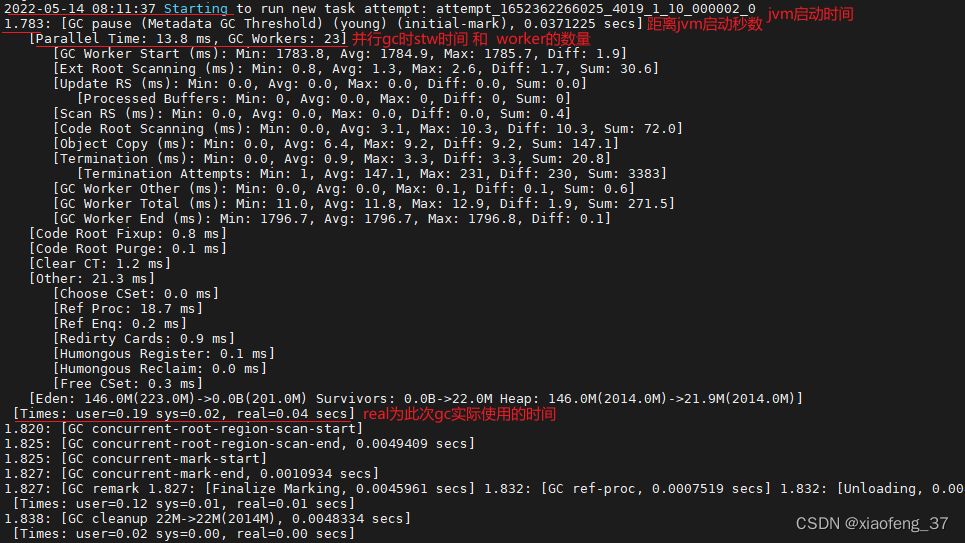
1.783: [GC pause (Metadata GC Threshold) (young) (initial-mark), 0.0371225 secs]
[Parallel Time: 13.8 ms, GC Workers: 23]
2. yarn的几个基础命令
app|application      prints application(s) report/kill application/manage long running application
applicationattempt   prints applicationattempt(s) report
container            prints container(s) report
logs                 dump container logs
3. find的-type参数 及 grep的-o -e参数
find [options]
-type c
      d      文件夹:directory
      p      named pipe (FIFO)
      f      常规文件:regular file
      s      套接字:socket

grep [options]
-e, --regexp=PATTERN  正则:use PATTERN for matching
-i, --ignore-case     忽略大小写:ignore case distinctions
-w, --word-regexp     匹配完整单词:force PATTERN to match only whole words
-v, --invert-match    反向选择匹配内容:select non-matching lines
-n, --line-number     打印所在行号:print line number with output lines
-h, --no-filename     结果首列不输出文件名:suppress the file name prefix on output
-o, --only-matching   只输出匹配到的部分:show only the part of a line matching PATTERN
-r, --recursive       文件夹递归:like --directories=recurse
[注]:
egrep 等同 grep -e
二、app日志查看
1. 直接使用yarn logs,可选择指定日志类型,也可"手动"重定向至本地文件
代码如下(示例):
$ yarn logs -applicationId application_1652362266025_4019 -log_files stderr 2>/dev/null | head
Container: container_e105_1652362266025_4019_01_000022 on ***-bg-w03_45454_1652490636096
LogAggregationType: AGGREGATED
=========================================================================================
LogType:stderr
LogLastModifiedTime:Sat May 14 09:10:36 +0800 2022
LogLength:188
LogContents:
2022-05-14 08:11:37 Starting to run new task attempt: attempt_1652362266025_4019_1_10_000002_0
2022-05-14 08:11:41 Completed running task attempt: attempt_1652362266025_4019_1_10_000002_0
...
2. 使用yarn logs查看,并使用-out参数"自动"落盘本地文件
# 没权限安装tree 此处用的另一集群
# 将日志落盘到当前文件夹logs中
$ yarn logs -applicationId application_1650527019982_0697 -out ./logs
# 查看日志目录结构 子目录为节点名称 内部的文件为节点中运行此app的container的日志
$ tree logs/
logs/
├── node-group-***1.mrs-lcnd.com_8041
│   ├── container_e03_1650527019982_0697_01_000001
│   ├── container_e03_1650527019982_0697_01_000003
│   ├── container_e03_1650527019982_0697_01_000012
...
├── node-group-***2.mrs-lcnd.com_8041
│   ├── container_e03_1650527019982_0697_01_000002
│   ├── container_e03_1650527019982_0697_01_000004
│   ├── container_e03_1650527019982_0697_01_000006
...
│   └── container_e03_1650527019982_0697_01_000044
└── node-group-***3.mrs-lcnd.com_8041
    ├── container_e03_1650527019982_0697_01_000005
    ├── container_e03_1650527019982_0697_01_000009
    ├── container_e03_1650527019982_0697_01_000010
...
# 因为没有使用-log_files进行过滤,所有每个文件都包含所属container的所有日志类型,可使用以下命令验证:
$ cat logs/node-group-***1.mrs-lcnd.com_8041/container_e03_1650527019982_0697_01_000001 | egrep -i '^LogType'
LogType:container-localizer-syslog
LogType:directory.info
LogType:launch_container.sh
LogType:prelaunch.out
LogType:stderr
LogType:stdout
LogType:syslog
3. 查看running状态app的containerId及其日志
# 1. 获取application的attemptId
$ yarn applicationattempt -list application_1652362266025_4832 2>/dev/null
Total number of application attempts :1
         ApplicationAttempt-Id         State      AM-Container-Id                                 Tracking-URL
appattempt_1652362266025_4832_000001   RUNNING    container_e105_1652362266025_4832_01_000001     http://****-bg-w01:8088/proxy/application_1652362266025_4832/

# 2. 获取此attempt对应的container
$ yarn container -list appattempt_1652362266025_4832_000001 2>/dev/null
# 输出格式同上  为方便查看  此处转换一下格式
Total number of containers :1
# 表头              # 内容
Container-Id       container_e105_1652362266025_4832_01_000001
Start Time         Sat May 14 16:19:38 +0800 2022
Finish Time        N/A
State              RUNNING
Host               ****-bg-w18:45454
Node Http Address  http://****-bg-w18:8042
LOG-URL            http://****-bg-w01:8188/applicationhistory/logs/****-bg-w18:45454/container_e105_1652362266025_4832_01_000001/container_e105_1652362266025_4832_01_000001/dmp_operator1

# 此为一个hive应用,当前没有查询任务,列表中只有1个running状态的container,对比发现,此container就是am所在的container,当有查询任务运行时,此处会出现多个container

# 3. 查看container的日志
$ yarn logs -containerId container_e105_1652362266025_4835_01_000001 -log_files stderr 2>/dev/null | head
Container: container_e105_1652362266025_4835_01_000001 on ****-bg-w19:45454
LogAggregationType: LOCAL
===========================================================================
LogType:stderr
LogLastModifiedTime:Sat May 14 16:32:26 +0800 2022
LogLength:472
LogContents:
2022-05-14 16:23:24 Running Dag: dag_1652362266025_4835_1
2022-05-14 16:23:59 Completed Dag: dag_1652362266025_4835_1
2022-05-14 16:25:45 Running Dag: dag_1652362266025_4835_2
...
4. 如何查询已结束运行的container信息
通过3发现,通过attemptId只能查询处于运行状态的container信息,如果想要查看历史的信息,可以使用yarn logs
$ lg -show_application_log_info
Application State: Completed.
Container: container_e105_1652362266025_4019_01_000022 on ****-bg-w03_45454_1652490636096
Container: container_e105_1652362266025_4019_01_000009 on ****-bg-w04_45454_1652490635977
Container: container_e105_1652362266025_4019_01_000014 on ****-bg-w04_45454_1652490635977
Container: container_e105_1652362266025_4019_01_000020 on ****-bg-w06_45454_1652490636083
Container: container_e105_1652362266025_4019_01_000012 on ****-bg-w07_45454_1652490636059
...
# 使用egrep -o 从中切分出container的id
$ lg -show_application_log_info | egrep -o 'container_e[_0-9]*'
container_e105_1652362266025_4019_01_000022
container_e105_1652362266025_4019_01_000009
container_e105_1652362266025_4019_01_000014
container_e105_1652362266025_4019_01_000020
container_e105_1652362266025_4019_01_000012
...
# 同理也可切分出node节点,不过node节点也可以使用命令查看
$ lg -list_nodes
****-bg-w03_45454_1652490636096
****-bg-w04_45454_1652490635977
****-bg-w06_45454_1652490636083
****-bg-w07_45454_1652490636059
****-bg-w10_45454_1652490636542
...
5. 查看gc日志
gc日志在yarn中的类型为:LogType:stdout
通过下图,我们主要从日志提取 时间offset 和 gc实际用时real 两行,对gc情况有个大致的了解
1. 使用命令查看
# app级别: yarn logs -applicationId <application ID>
# container级别: yarn logs -applicationId <application ID> -containerId <Container ID>
# 实操中可能后者更有意义,因为gc一般出现在个别container中
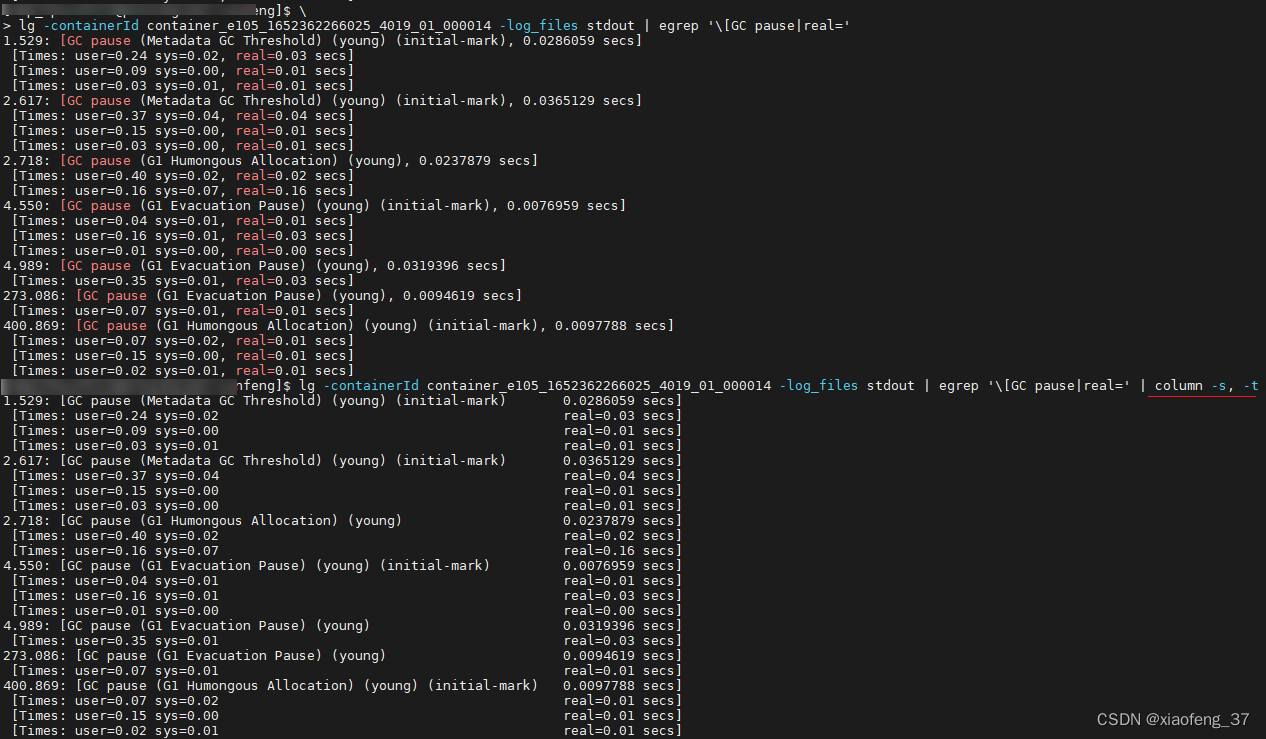
$ lg -containerId container_e105_1652362266025_4019_01_000014 -log_files stdout | egrep '\[GC pause|real='
1.529: [GC pause (Metadata GC Threshold) (young) (initial-mark), 0.0286059 secs]
[Times: user=0.24 sys=0.02, real=0.03 secs]
[Times: user=0.09 sys=0.00, real=0.01 secs]
[Times: user=0.03 sys=0.01, real=0.01 secs]
...
273.086: [GC pause (G1 Evacuation Pause) (young), 0.0094619 secs]
[Times: user=0.07 sys=0.01, real=0.01 secs]
400.869: [GC pause (G1 Humongous Allocation) (young) (initial-mark), 0.0097788 secs]
[Times: user=0.07 sys=0.02, real=0.01 secs]
[Times: user=0.15 sys=0.00, real=0.01 secs]
[Times: user=0.02 sys=0.01, real=0.01 secs]
# 输出格式化
$ lg -containerId container_e105_1652362266025_4019_01_000014 -log_files stdout | egrep '\[GC pause|real=' | column -s, -t
1.529: [GC pause (Metadata GC Threshold) (young) (initial-mark) 0.0286059 secs]
[Times: user=0.24 sys=0.02 real=0.03 secs]
[Times: user=0.09 sys=0.00 real=0.01 secs]
[Times: user=0.03 sys=0.01 real=0.01 secs]
2.617: [GC pause (Metadata GC Threshold) (young) (initial-mark) 0.0365129 secs]
[Times: user=0.37 sys=0.04 real=0.04 secs]
[Times: user=0.15 sys=0.00 real=0.01 secs]
[Times: user=0.03 sys=0.00 real=0.01 secs]
...
2. 使用-out落盘到本地,使用shell命令查看
# 使用命令找出绝对路径
$ find logs/ -type f
logs/****-bg-w03_45454_1652490636096/container_e105_1652362266025_4019_01_000022
logs/****-bg-w17_45454_1652490635505/container_e105_1652362266025_4019_01_000005
logs/****-bg-w21_45454_1652490636022/container_e105_1652362266025_4019_01_000011
logs/****-bg-w10_45454_1652490636542/container_e105_1652362266025_4019_01_000023
...
# 同上,cat后使用egrep进行查看
# 这里演示一下gc次数统计
$ find logs/ -type f | while read line
> do
> echo $line
> egrep '\[GC pause' $line | wc -l
> done
logs/****-bg-w03_45454_1652490636096/container_e105_1652362266025_4019_01_000022
3
logs/****-bg-w17_45454_1652490635505/container_e105_1652362266025_4019_01_000005
5
logs/****-bg-w21_45454_1652490636022/container_e105_1652362266025_4019_01_000011
2
logs/****-bg-w10_45454_1652490636542/container_e105_1652362266025_4019_01_000023
1304
logs/****-bg-w06_45454_1652490636083/container_e105_1652362266025_4019_01_000020
5
...
# 很显然,其中一个container的gc次数过于频繁
总结
其实yarn开启日志聚合功能以后,很多都可以网页端查看,但是使用命令其实可以实现更加强大和精细化的功能,可以通过官方的–help文档多多学习和测试。
上述命令也可以写一个简单的脚本进行封装,以方便出现异常时进行快速定位。
如有错误或者更好的方法还请大家不吝指正,大家一起变得更强!

为开发者提供学习成长、分享交流、生态实践、资源工具等服务,帮助开发者快速成长。
更多推荐


 5
5 0
0- 0


 已为社区贡献1条内容

所有评论(0)