C# chart画折线
提示:文章写完后,目录可以自动生成,如何生成可参考右边的帮助文档文章目录版本一(DataGridView 和 Chart)1.小目标2.过程实现3.结果二、版本二(Combobox 和 Chart)1.小目标2.过程实现3.浅贴一下效果总结版本一(DataGridView 和 Chart)1.小目标控件绑定Sql Sever 数据库DataGridView列出数据,Chart画折线2.过程实现ch
·
提示:文章写完后,目录可以自动生成,如何生成可参考右边的帮助文档
文章目录
一、版本一(DataGridView 和 Chart)
1.小目标
-
控件绑定Sql Sever 数据库
-
DataGridView列出数据,Chart画折线
2.过程实现
-
chart的初始设置(个人习惯)
-
1.图列关掉(属性>Legends>(Enabled)=False>确定)

-
2.去网格X轴(属性>ChartAreas>Axes>X axis>MajorGrid>Enanled=False)

-
3.去网格Y轴(X轴设置好,直接按Y(Value) axis>MajorGrid>Enanled=False>确定)

-
4.柱状图变为折线(属性>Series>ChartType>Line>确定)

-
5.铺满上半页面(属性>Dock>top)

-
-
DataGridView的初始设置(个人习惯)
-
1.放左边方便查看数据(属性>Dock>Left)

-
2.数据设置(编辑列,按图顺序添加列名和绑定数据,完成后确定)

添加两个列名
-

数据绑定


- 具体代码(在窗体加载事件里写)
1.创建SqlHelper类
 public static class SqlHelper
    {
        public static DataTable GetData(string sql)
        {
            DataTable dataTable = new DataTable();
            string connString = "Data Source=.;Initial Catalog = Line;User ID = sa;Password=abcdef";
            SqlConnection conn = new SqlConnection(connString);
            SqlCommand cmd = new SqlCommand(sql, conn);
            cmd.Parameters.Clear();
            conn.Open();
            SqlDataAdapter da = new SqlDataAdapter();
            da.SelectCommand = cmd;
            conn.Close();
            da.Fill(dataTable);
            return dataTable;
        }
    }
2.窗体代码
private void Form1_Load(object sender, EventArgs e)
        {
            string Sql = "select numX,numY from BrokenLine30";
            //DataGridView绑定
            DataTable dt = SqlHelper.GetData(Sql);
            dataGridView1.DataSource = dt;
            //画图
            for(int i =0; i<dt.Rows.Count;i++)
            {
                chart1.Series[0].Points.AddXY(i+1,dt.Rows[i][1]);
            }
            //设置Y轴范围(属性>ChartArea>Axes>Y(Value)axis>Maximum和Minimun里也能设置)
            chart1.ChartAreas[0].AxisY.Minimum = 27.5;
            chart1.ChartAreas[0].AxisY.Maximum = 31.5;
            //粗细(属性中也能设置)
            chart1.Series[0].BorderWidth = 3;
        }
3.结果
- 读取到了数据库中的数据,显示在表格中

- 下一步是画出折线

- 做一下改善,将线变粗,设置了Y轴上下限
- X轴还可以在属性中做更一步设置,让折线从1开始
- 空白部分还能发挥空间,添加一些标签和文本,做些数据统计

二、版本二(Combobox 和 Chart)
1.小目标
- Combobox选择不同的值,Chart显示相对应的折线
- 在Chart中显示具体数据、Y轴上下限随数值变化,添加三条辅助线,分别代表数据中的最大值,最小值和标准值
2.过程实现
- 界面设置
与前一部分设置相同,主要是只想呈现X轴和Y轴
combobox属性中(Name)改为cbbMidLine
放一些标签和文本,分别改(Name)为textAvg,textMAX,textMIN,textCount

- SqlHelper类
public static class SqlHelper
    {
        public static DataTable GetDataTable(string sql)
        {
            DataTable dataTable = new DataTable();
            string connString = "Data Source=.;Initial Catalog = Line;User ID = sa;Password=abcdef";
            SqlConnection conn = new SqlConnection(connString);
            SqlCommand cmd = new SqlCommand(sql, conn);
            cmd.Parameters.Clear();
            conn.Open();
            SqlDataAdapter da = new SqlDataAdapter();
            da.SelectCommand = cmd;
            conn.Close();
             da.Fill(dataTable);
            return dataTable;
        }
        public static double Count(string sql)
        {
            double result = 0;
            string connString = "Data Source=.;Initial Catalog = Line;User ID = sa;Password=abcdef";
            SqlConnection conn = new SqlConnection(connString);
            SqlCommand cmd = new SqlCommand(sql, conn);
            cmd.Parameters.Clear();
            conn.Open();
            result = Convert.ToDouble(cmd.ExecuteScalar());
            return result;
        }
    }

- Line类
public static  class Line
    {
        public static StripLine SetLine(string sql,out  double Line)
        {
            string connString = "Data Source=DESKTOP-JQOODRR;Initial Catalog = Line;User ID = sa;Password=abcdef";
            SqlConnection conn = new SqlConnection(connString);
            SqlCommand cmd = new SqlCommand(sql, conn);
            cmd.Parameters.Clear();
            conn.Open();
             Line= Convert.ToDouble(cmd.ExecuteScalar());
            conn .Close();
            StripLine stripLine = new StripLine();
            stripLine.Interval = 0;//偏移
            stripLine.IntervalOffset = Line;//刻度
            stripLine.StripWidth = 0.02;
            stripLine.BackColor =Color.DarkGreen;
            stripLine.Text = String.Format("{0:F}", Line);
            return stripLine;
        }
        public static StripLine DrawMid(double a)
        {
            StripLine stripMid=new StripLine();
            stripMid.Interval = 0;//偏移
            stripMid.StripWidth = 0.03;
            stripMid.IntervalOffset = a;
            stripMid.BackColor = Color.Orange;

            stripMid.Text = string.Format("标准值:{0:F}",a);
            return stripMid;
        }
    }

- 窗体代码
private void Form1_Load(object sender, EventArgs e)
        {
            string sqlS = "select numX,numY from BrokenLine30";
            DataTable dt = SqlHelper.GetDataTable(sqlS);
            //dgvLine.DataSource = dt;

            //combobox数据绑定
            string sqlM = "select * from MidLLine";
            DataTable dtM = SqlHelper.GetDataTable(sqlM);
            cbbMidLine.DataSource = dtM;
            cbbMidLine.ValueMember = "MidLine";
            cbbMidLine.DisplayMember = "MidLine";

        }

        private void cbbMidLine_SelectedIndexChanged(object sender, EventArgs e)
        {

            double Max,Min,Mid;
            StripLine stripMax , stripMin, stripMid;

            if (cbbMidLine.SelectedIndex == 0)
            {
                string sqlA = "select AVG(numY) from BrokenLine10 ";
                string sqlMax = "select MAX(numY) from BrokenLine10";
                string sqlMin = "select MIN(numY) from BrokenLine10";
                string sqlCount = "select count(1) from BrokenLine10";

                stripMax = Line.SetLine(sqlMax,0.02,Color.DarkGreen,out Max);
                textMAX.Text = Max.ToString();
                stripMin= Line.SetLine(sqlMin,0.02,Color.DarkGreen,out Min);
                textMIN.Text = Min.ToString();
                stripMid=Line.SetLine(sqlA,0.03,Color.Orange,out Mid);
                texAvg.Text = Mid.ToString("0.00");
                double Count=SqlHelper.Count(sqlCount);
                textCount.Text = Count.ToString();

                stripMid.Text = string.Format("标准值:{0:F}", 10);//展示文本
                stripMid.IntervalOffset = 10;

                string sqlS = "select numX,numY from BrokenLine10";
                DataTable dt = SqlHelper.GetDataTable(sqlS);
                chart1.DataSource = dt;
                for (int i = 0; i < dt.Columns.Count; i++)
                {
                    chart1.Series[0].YValueMembers = dt.Columns[i].ColumnName;
                }
                chart1.ChartAreas[0].AxisY.StripLines.Add(stripMax);
                chart1.ChartAreas[0].AxisY.StripLines.Add(stripMin);
                chart1.ChartAreas[0].AxisY.StripLines.Add(stripMid);
                this.chart1.ChartAreas[0].AxisY.Minimum = Min-0.05;
                this.chart1.ChartAreas[0].AxisY.Maximum = Max+0.05;
            }
            if (cbbMidLine.SelectedIndex == 1)
            {
                string sqlA = "select AVG(numY) from BrokenLine20 ";
                string sqlMax = "select MAX(numY) from BrokenLine20";
                string sqlMin = "select MIN(numY) from BrokenLine20";
                string sqlCount = "select count(1) from BrokenLine20";
                stripMax = Line.SetLine(sqlMax, 0.02, Color.DarkGreen, out Max);
                textMAX.Text = Max.ToString();
                stripMin = Line.SetLine(sqlMin, 0.02, Color.DarkGreen,out Min);
                textMIN.Text = Min.ToString();
                stripMid=Line.SetLine(sqlA, 0.03, Color.Orange, out Mid);
                texAvg.Text = Mid.ToString("0.00");
                double Count = SqlHelper.Count(sqlCount);
                textCount.Text = Count.ToString();

                stripMid.Text = string.Format("标准值:{0:F}", 20);
                stripMid.IntervalOffset = 20;

                string sqlS = "select numX,numY from BrokenLine20";
                DataTable dt = SqlHelper.GetDataTable(sqlS);
                chart1.DataSource = dt;
                for (int i = 0; i < dt.Columns.Count; i++)
                {
                    chart1.Series[0].YValueMembers = dt.Columns[i].ColumnName;
                }

                chart1.ChartAreas[0].AxisY.StripLines.Add(stripMax);
                chart1.ChartAreas[0].AxisY.StripLines.Add(stripMin);
                chart1.ChartAreas[0].AxisY.StripLines.Add(stripMid);
                this.chart1.ChartAreas[0].AxisY.Minimum = Min-0.05;
                this.chart1.ChartAreas[0].AxisY.Maximum = Max+0.05;
            }
            if (cbbMidLine.SelectedIndex == 2)
            {
                string sqlA = "select AVG(numY) from BrokenLine30 ";
                string sqlMax = "select MAX(numY) from BrokenLine30";
                string sqlMin = "select MIN(numY) from BrokenLine30";
                string sqlCount = "select count(1) from BrokenLine30";
                stripMax = Line.SetLine(sqlMax, 0.02, Color.DarkGreen, out Max);
                textMAX.Text = Max.ToString();
                stripMin = Line.SetLine(sqlMin, 0.02, Color.DarkGreen, out Min);
                textMIN.Text = Min.ToString();
                stripMid = Line.SetLine(sqlA, 0.03, Color.Orange, out Mid);
                texAvg.Text = Mid.ToString("0.00");

                double Count = SqlHelper.Count(sqlCount);
                textCount.Text = Count.ToString();

                stripMid.Text = string.Format("标准值:{0:F}", 30);
                stripMid.IntervalOffset = 30;

                string sqlS = "select numX,numY from BrokenLine30";
                DataTable dt = SqlHelper.GetDataTable(sqlS);
                chart1.DataSource = dt;
                for (int i = 0; i < dt.Columns.Count; i++)
                {
                    chart1.Series[0].YValueMembers = dt.Columns[i].ColumnName;
                }

                chart1.ChartAreas[0].AxisY.StripLines.Add(stripMax);
                chart1.ChartAreas[0].AxisY.StripLines.Add(stripMin);
                chart1.ChartAreas[0].AxisY.StripLines.Add(stripMid);
                this.chart1.ChartAreas[0].AxisY.Minimum = Min-0.05;
                this.chart1.ChartAreas[0].AxisY.Maximum = Max+0.05;
            }
            if (cbbMidLine.SelectedIndex == 3)
            {
                string sqlA = "select AVG(numY) from BrokenLine40 ";
                string sqlMax = "select MAX(numY) from BrokenLine40";
                string sqlMin = "select MIN(numY) from BrokenLine40";
                string sqlCount = "select count(1) from BrokenLine40";
                stripMax = Line.SetLine(sqlMax, 0.02, Color.DarkGreen, out Max);
                textMAX.Text = Max.ToString();
                stripMin = Line.SetLine(sqlMin, 0.02, Color.DarkGreen, out Min);
                textMIN.Text = Min.ToString();
                stripMid = Line.SetLine(sqlA, 0.03, Color.Orange, out Mid);
                texAvg.Text = Mid.ToString("0.00");

                double Count = SqlHelper.Count(sqlCount);
                textCount.Text = Count.ToString();

                stripMid.Text = string.Format("标准值:{0:F}", 40);//展示文本
                stripMid.IntervalOffset = 40;

                string sqlS = "select numX,numY from BrokenLine40";
                DataTable dt = SqlHelper.GetDataTable(sqlS);
                chart1.DataSource = dt;
                for (int i = 0; i < dt.Columns.Count; i++)
                {
                    chart1.Series[0].YValueMembers = dt.Columns[i].ColumnName;
                }

                chart1.ChartAreas[0].AxisY.StripLines.Add(stripMax);
                chart1.ChartAreas[0].AxisY.StripLines.Add(stripMin);
                chart1.ChartAreas[0].AxisY.StripLines.Add(stripMid);
                this.chart1.ChartAreas[0].AxisY.Minimum = Min-0.05;
                this.chart1.ChartAreas[0].AxisY.Maximum = Max+0.05;
            }
            if (cbbMidLine.SelectedIndex == 4)
            {
                string sqlA = "select AVG(numY) from BrokenLine50 ";
                string sqlMax = "select MAX(numY) from BrokenLine50";
                string sqlMin = "select MIN(numY) from BrokenLine50";
                string sqlCount = "select count(1) from BrokenLine50";
                stripMax = Line.SetLine(sqlMax, 0.02, Color.DarkGreen, out Max);
                textMAX.Text = Max.ToString();
                stripMin = Line.SetLine(sqlMin, 0.02, Color.DarkGreen, out Min);
                textMIN.Text = Min.ToString();
                stripMid = Line.SetLine(sqlA, 0.03, Color.Orange, out Mid);
                texAvg.Text = Mid.ToString("0.00");

                double Count = SqlHelper.Count(sqlCount);
                textCount.Text = Count.ToString();

                stripMid.Text = string.Format("标准值:{0:F}", 50);//展示文本
                stripMid.IntervalOffset = 50;

                string sqlS = "select numX,numY from BrokenLine50";
                DataTable dt = SqlHelper.GetDataTable(sqlS);
                chart1.DataSource = dt;
                for (int i = 0; i < dt.Columns.Count; i++)
                {
                    chart1.Series[0].YValueMembers = dt.Columns[i].ColumnName;
                }

                chart1.ChartAreas[0].AxisY.StripLines.Add(stripMax);
                chart1.ChartAreas[0].AxisY.StripLines.Add(stripMin);
                chart1.ChartAreas[0].AxisY.StripLines.Add(stripMid);
                this.chart1.ChartAreas[0].AxisY.Minimum = Min-0.05;
                this.chart1.ChartAreas[0].AxisY.Maximum = Max+0.05;
            }
        }
- 窗体Load事件是双击触发
- combobox(在此项目中改名为cbbMidLine)的值改变事件是在属性里的事件里找到SelectedChanged再点击

- 点击完的效果

- 数据库的设计

- 表的设计
BrokenLine10–BrokenLine50,设计都是一样的 此表放平均值
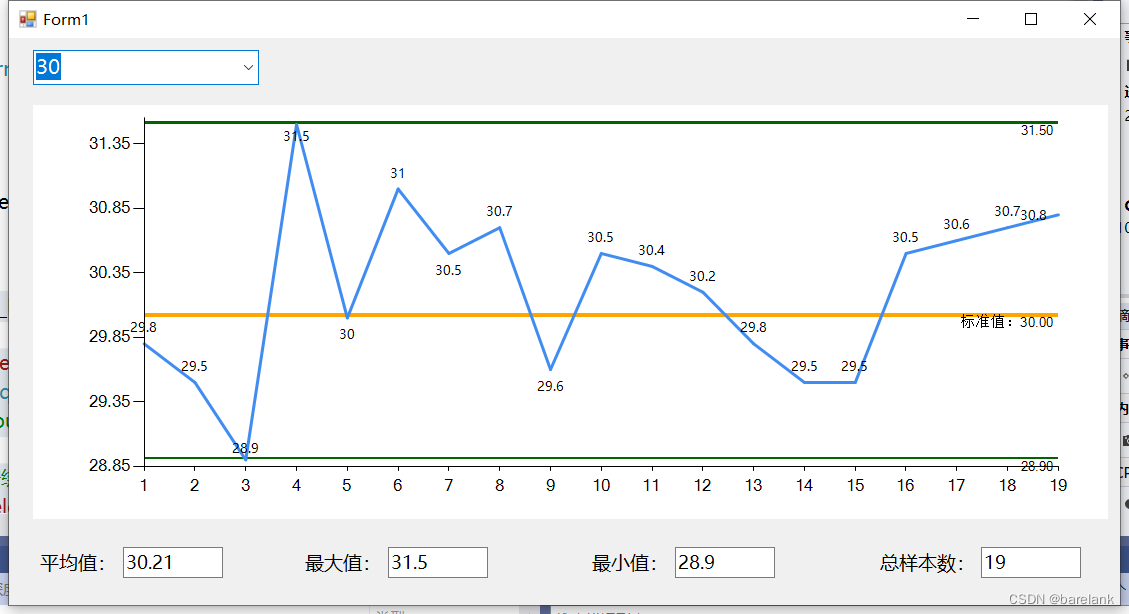
3.浅贴一下效果
- 标准值为10

- 20

- 30

算是完结了吧 ,有问题一起交流鸭

为开发者提供学习成长、分享交流、生态实践、资源工具等服务,帮助开发者快速成长。
更多推荐


 18
18 0
0- 0


 已为社区贡献1条内容

所有评论(0)