《性能之巅第2版》阅读笔记(一)--操作系统基础
System performance: Enterprise and the Cloud, 2nd Edition
《System Performance: Enterprise and the Cloud, 2nd Edition (2020)》阅读笔记简要记录
1. 简介
1.4 视角
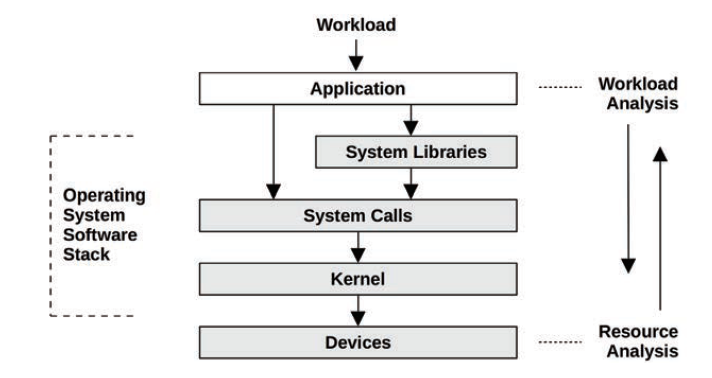
| 性能分析视角 | |
|---|---|
| 工作负载分析 | 应用开发人员关心 |
| 资源分析 | 系统管理员关心 |
1.5 性能分析的挑战性
| 主观性 | 技术一般是客观的,但性能一般是主观性很强的 比如“The average disk I/O response time is 1 ms”是“好”还是“差”,恐怕也因人而已; |
| 复杂性 | 系统整体的复杂性; 多模块交互的复杂性(单个模块可能没问题,交互就会出现性能问题) 性能瓶颈问题 工作负载的复杂 |
| 多原因 | 性能问题往往很难找到根原因;比如多个单独看起来没问题的事件一起发生就引起了性能问题 |
| 多问题并存 | 即使一个成熟的系统上,也会有许多已知但未解决的性能问题;性能分析的难点之一并不是找一个性能问题,而是找到和你问题最相关的performance issues; 量化分析(quantify)issues的重要程度,并且估计解决后能带来的性能提升程度; latency(延时)非常适合用来量化性能指标; |
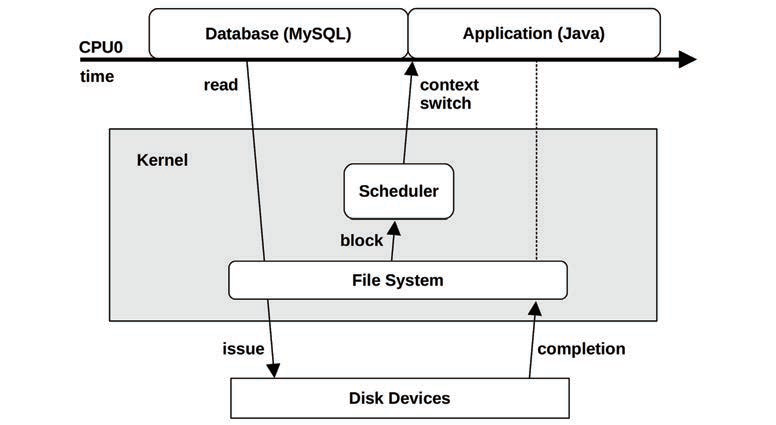
1.6 延时latency
latency是什么:是等待完成的时间;
Latency is a measure of time spent waiting, and is an essential performance metric
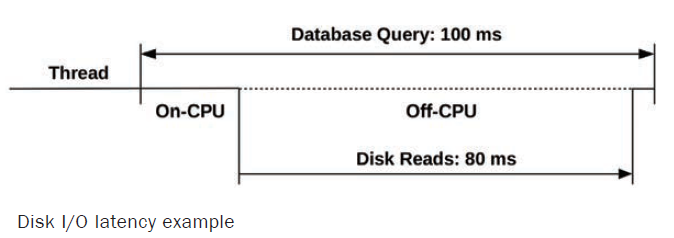
如图,访问数据库的latency是100ms,其中阻塞再磁盘读写上占了80ms,那么可以消除磁盘读写的性能损耗,使得latency降至20ms,性能提升5倍(5x),这个提升是可以量化的;
上面计算方法不一定适用于其他metrics(指标)。
1.7 观察性能observability
系统可观察,观察的工具一般分几类:
| 观察工具使用的方法 | |
|---|---|
| 计数器(counters) | 应用程序和内核通常会提供有关其状态和活动的数据:操作计数,字节计数,延迟测量,资源利用率和错误率。 它们通常以称为计数器的整数变量的形式实现,这些变量在软件中进行了硬编码,其中一些是累积的且始终递增 |
| 分析(profiling) | 在系统性能中,术语“分析”通常是指使用执行采样的工具:通过测量数据的子集绘制一些粗略的示图等 |
| 跟踪(tracing) | 跟踪一般都是基于事件驱动的数据采集过程,例如针对系统调用的追踪工具strace,针对网络分析的抓包工具tcpdump,通用能追踪软硬件事件的跟踪工具如ftrace、bcc以及bpftrace等 |
观察的工具一般不包括benchmark工具,因为它是通过workload来测试系统得出数据,这便修改了系统的原始状态;
counters、statistics、metrics
# 何为counters?
# 在《system performance: enterprise and cloud, 2nd》一书中得到了比较权威的解释
Applications and the kernel typically provide data on their state and activity: operation counts,byte counts, latency measurements, resource utilization, and error rates. They are typicallyimplemented as integer variables called counters that are hard-coded in the software, some ofwhich are cumulative and always increment.
# 计数器:应用程序或者内核通常会在软件中硬编码进去一些整形变量,用于操作统计、字节统计、延时衡量、资源利用统计、错误计数等;比如/proc文件系统下的各种统计文件节点;
profiling
# 何为profiling?
In systems performance, the term profiling usually refers to the use of tools that perform sampling:taking a subset (a sample) of measurements to paint a coarse picture of the target.
# 基于工具的样点采集,并用其中的数据绘制一些直观示意图的分析方法;
tracing
跟踪一般都是基于事件驱动的数据采集过程,例如针对系统调用的追踪工具strace,针对网络分析的抓包工具tcpdump,通用能追踪软硬件事件的跟踪工具如ftrace、bcc以及bpftrace等。这些都基于event source,比如静态测量点、动态测量点以及可编程工具bpf;
static instrument在linux中又叫tracepoints,硬编码的测量追踪点;
dynamic instrument类似动态debug一样,软件运行中在内存中插入instrument测量点;Dtrace工具值得好好分析下;
BPF,原来是代表berkerly packet filter,但现在已经不是这个意思了,它也不算缩写,就代表一种方法,一种跟踪方法;eBPF was initially used to describe this extended BPF; however, the technology is now referred to as just BPF;
1.8 测试性能experimentation
macro-benchmark tools 较为宏观的整体负载测试工具;
micro-benchmark tools 针对具体小方向的负载测试工具,比如网络、cpu等;
1.9 云计算cloud computing
1.10 方法论methodology
2. 方法
2.1 术语
系统性能的关键术语
| 术语 | |
|---|---|
| IOPS | 数据传输的一个度量方法,input/outpu per second;对于磁盘读写,IOPS指每秒读和写的次数; |
| throughput | 评价操作执行的速率;数据传输方面,throughput用于描述数据传输速度(bytes/s或bits/s)。某些场景下如数据库,吞吐量指的是操作的速度(每秒的操作数或者每秒业务数) |
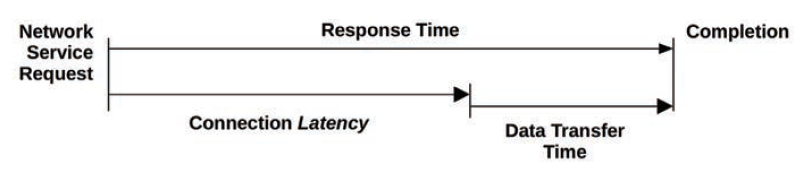
| response time | 一个操作完成所需要的时间,包括等待时间、执行时间、结果返回时间等; |
| latency | 延时时间,一个操作等待被执行所花费的时间;某些场景下,也可指response time; |
| utilization | 使用率,资源使用率; |
| saturation | 饱和度,资源无法满足服务的工作排队工作量程度; |
| bottleneck | 瓶颈,系统性能中指性能上限; |
| workload | 工作负载; |
| cache | 缓存,用于复制或者缓冲一定量数据的高速存储区域; |
2.2 模型
SUT: system under test
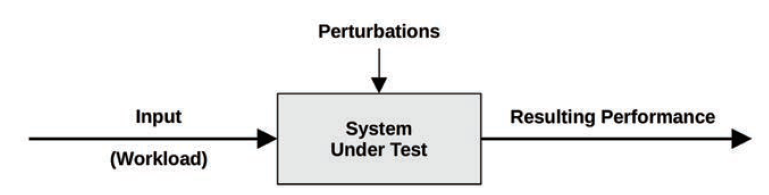
perturbations(扰动)会影响系统测试结果。
perturbations有哪些:scheduled system activity、other users of the system、 other workloads。
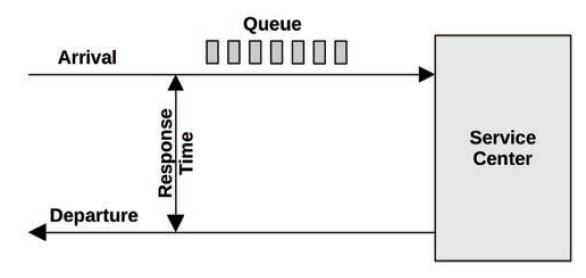
queueing system
很多工作组件和场景可以抽象成queue system model。 比如磁盘读写;
2.3 概念
2.3.1 latency
延时,性能研究的关键角色;
latency 和 throughput 是某些性能研究的最关键的要点;
何为latency:操作等待被执行的时间;
2.3.2 time scales
系统各组件的操作所处的时间量级差别很大。比如一次寄存器访问延时0.3ns,相当于生活中的1s时间。
2.3.3 权衡三角
常见的性能调整的权衡是CPU和memory之间,因为内存能用于缓存数据结果,降低的CPU的使用。
3. 操作系统
3.1 术语
| 常见术语 | |
|---|---|
| operating system | 操作系统,安装在系统环境上的可用于执行程序的软件和文件系统,包含kernel、管理tools、系统库等; |
| kernel | 内核,管理系统的程序,管理硬件设备、内存、CPU调度,对CPU拥有特权; |
| process | 进程,OS中抽象出来的用于执行程序的实体; |
| thread | 线程,可被CPU调度的执行context;内核有多个线程,一个进程可以有一个或多个线程; |
| task | 任务,linux运行实体,可以指一个进程(单线程)、多线程进程中的一个线程、或者内核线程; |
| BPF program | 在BPF环境中运行的内核态程序; |
| main memory | 主存,系统的物理内存(比如RAM); |
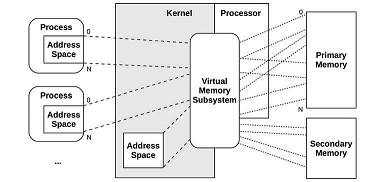
| virtual memory | 虚拟内存,支持多任务执行的主存的抽象概念; |
| kernel space | 内核空间,虚拟内存中给kernel使用的地址空间; |
| user space | 用户空间,虚拟内存中给user使用的地址空间; |
| user land | 用户级的程序和库(/usr/bin, /usr/lib…); |
| context switch | 上下文切换,一个进程或一个线程切换到另一个进程或线程,这是CPU调度器的基本功能,切换过程中包含对CPU寄存器的保存切换; |
| mode switch | 模式切换,用户态和内核态的切换; |
| system call | 系统调用; |
| processor | 处理器,一个包含一个或多个CPU的物理芯片; |
| trap | 陷入,给内核发送信号获取系统内核程序执行(特权执行),可通过系统调用、异常、中断触发trap; |
| hardware interrupt | 硬件中断,物理设备给内核kernel发送信号,获取如I/O等服务;一个中断便是一次trap; |
3.2 背景
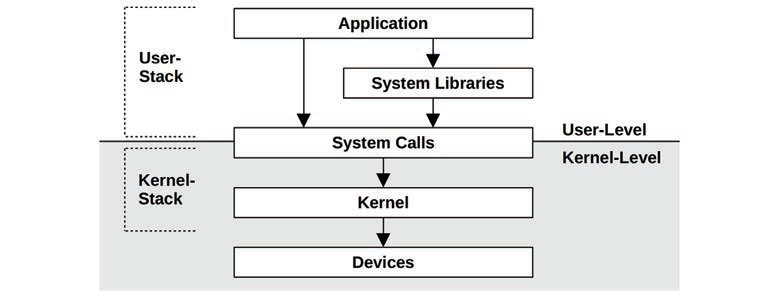
3.2.1 内核
system libraries并不是一个完整的圆环,因为linux运行应用程序直接调用system calls来进入内核;
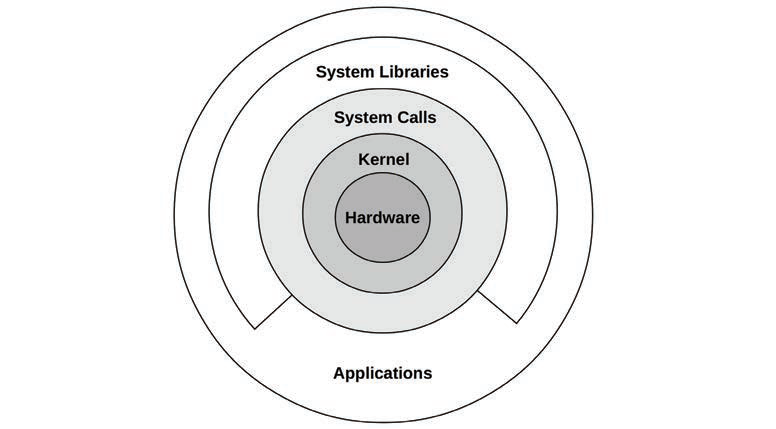
新的linux允许BPF程序调用KPI: BPF helper;这样便运行一些程序或者系统函数被用于BPF,提供更高的安全级别和高性能。
3.2.2 内核态和用户态
用户态切换到内核态,就叫mode switch。
用户态切换到内核态的过程中,那些阻塞在比如磁盘等待、网络/IO等地方的进程还会引起context switch,以便调度其他进程来执行;
mode switch 和 context switch会带来额外的CPU循环消耗,如何避免?
| 避免模式切换带来损耗的方法 | 详细 |
|---|---|
| user-mode syscalls | 用户态系统调用:可以在用户态实现部分系统调用功能,linux kernel通过将a virtual dynamic shared object(vDSO) 映射到进程地址空间中来实现,比如系统调用gettimeofday, getcpu等; |
| memory mappings | 内存映射:used for demand paging; |
| kernel bypass | 越过内核,比如DPDK(the data plane development kit); |
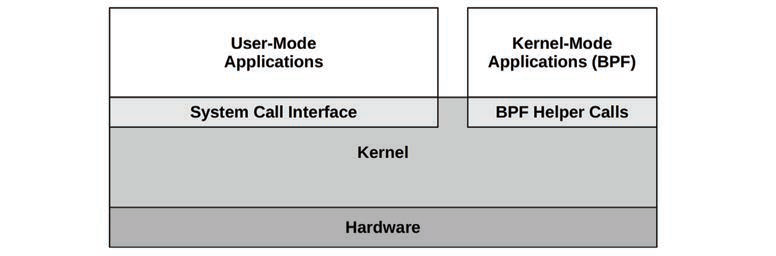
| kernel-mode applications | 内核态应用程序,比如TUX web服务器,eBPF技术等; |
用户态和内核态都有它们自己的执行环境,包含栈、寄存器。某些处理器架构将内核态和用户态的地址空间分隔,这样在模式切换时还需要切换虚拟内存环境。
3.2.3 系统调用
诸如write()/open()等等的system calls,一般器用途很明显。
以下几个用途不是很明显:
| 系统调用 | |
|---|---|
| ioctl | I/O设置以及一些混杂需求的设置下发; |
| mmap | This is commonly used to map executables and libraries to the process address space, and for memory-mapped files; |
| brk | 用于扩展堆指针,定义进程内存空间的大小; |
| futex | Fast user-space mutex,用于处理用户态锁; |
3.2.4 中断
同步中断、异步中断
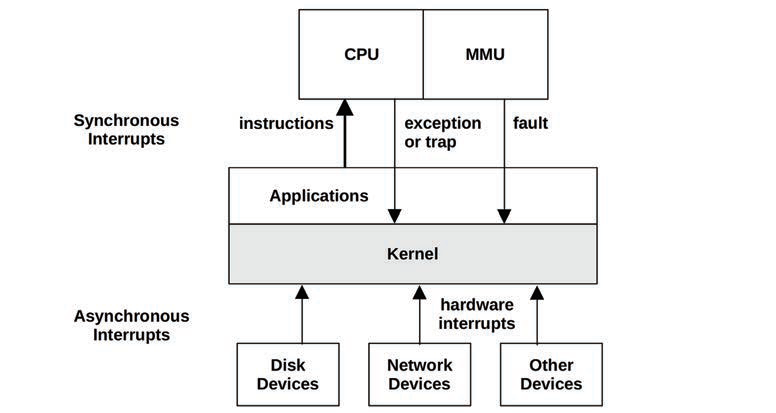
异步中断实例:
同步中断:
同步中断都是由软件指令产生的。
| 术语 | 详解 |
|---|---|
| traps | 对内核的一次谨慎调用,比如中断指令,例如linux-x86中的int 0x80软中断; |
| exceptions | 异常,比如除0; |
| fault | 通常用于内存事件,比如page fault; |
3.2.5 clock and idle
时钟中断,linux中用jiffies记录从开机到现在的时钟中断次数。unix内核中的一个重要组件就是clock()程序,时钟中断,通常表示为频率,linux现在是1000Hz,也就是1秒钟有1000个时钟中断,每个时钟中断间隔1ms,这叫tick(节拍),这也是性能影响因素之一,
- tick latency,节拍延迟,假设时钟频率是100Hz,那么进程延迟最多10ms就会进入下一个tick;这个问题用高频率real-time中断方式解决。
- tick overhead,节拍损耗,ticks消耗CPU周期,并会干扰应用程序,是operating system jitter的原因之一。
idle thread:当CPU空闲时,调度器会安排其到idle线程,idle任务能够power down CPU以节省能源;
3.2.6 进程
何为进程?
A process is an environment for executing a user-level program, It consists of a memory address space, file descriptors, thread stacks, and registers
何为线程?
A process contains one or more threads, which operate in the process address space and share the same file descriptors. A thread is an executable context consisting of a stack, registers, and an instruction pointer (also called a program counter).
# 共享进程地址空间和文件描述符,拥有自己的栈、寄存器和指令指针(program counter)
在Linux系统中,进程process和线程thread都称为任务task。
进程的创建fork()和clone()用了copy-on-write(COW)写时复制技术,以提高系统性能。
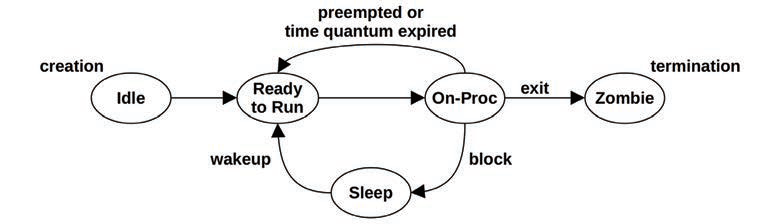
进程的生命周期:
进程环境总览:
process environment:
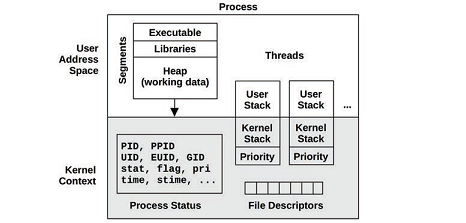
该图也不是完全准确:内核空间应该比用户空间小。
3.2.7 栈
3.2.8 虚拟内存
3.2.9 调度器
scheduler的目的是什么?
The basic intent is to divide CPU time among the active processes and threads, and to maintain a notion of priority so that more important work can execute sooner
# 基本目标是将CPU时间划分给不同的进程和线程,在优先级基础上保持平衡,以保证更重要的任务能够尽快被执行
调度器只对处于read-to-run状态的进程进行调度,需要被调度的进程在每个优先级的队列里,俗称运行队列run queues。
调度器可以动态的修改进程的priority以便提高系统性能。工作负载workloads可以分为两大类:
- CPU-bound:计算密集型;
- I/O-bound: I/O密集型;
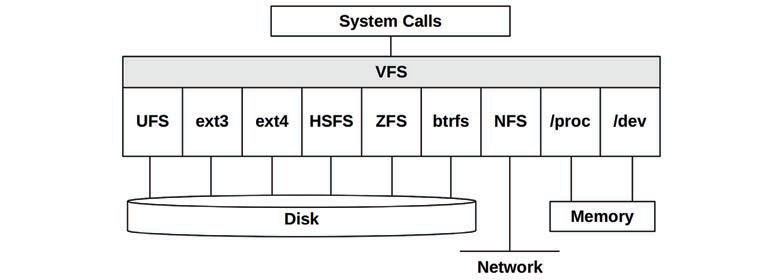
3.2.10 文件系统
文件系统通过mount来挂在到tree上。一个经典的文件组织架构图如下:

虚拟文件系统VFS:
是内核文件系统的一个抽象接口,方便添加管理新的文件系统。
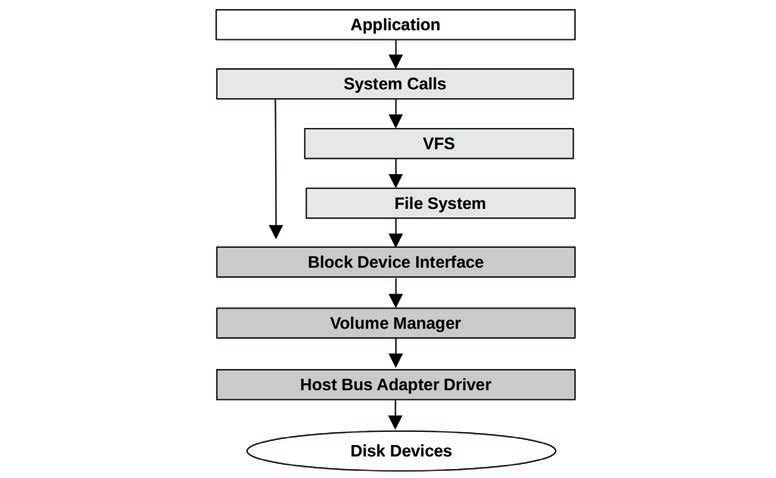
I/O栈:
什么是I/O栈:从用户态软件到存储设备的路径叫做I/O stack。下图中左边一条路径可以越过文件系统直达块存储设备,该路径经常被用于管理工具和数据库。
3.2.11 缓存
由于磁盘I/O操作的延时很长,软件栈中的很多层级通过缓存读写来避免这点缺点。
3.2.12 网络
TCP/IP协议栈
3.2.13 设备驱动
字符设备驱动、块设备驱动
3.2.14 多处理器
多处理器系统通常实现为SMP系统(symmetric multiprocessing,所有CPU被平等对待)。在SMP系统上,通常是NUMA(non-uniform memory access,非一致内存访问),这对性能也是一种挑战。
IPIs
SMP系统中,CPU之间也需要coordinate(同步协调),通过inter-processor interrupt(IPI)(也叫作SMP call或者CPU cross call)来实现,IPIs也用于抢占实现。
3.2.15 抢占
内核允许更高优先级的用户级进程来抢占内核并执行。
支持抢占的内核成为完全抢占的(fully preemptible),尽管其中有些代码还是不能被中断。
Linux还支持自愿内核抢占(voluntary kernel preemption),这能避免完全抢占的复杂性。
#CONFIG_PREEMPT_VOLUNTRAY ---- 自愿内核抢占
#CONFIG_PREEMPT ---- 允许所有内核代码(除了部分特殊段)开启抢占
#CONFIG_PREEMPT_NONE ---- 关闭抢占
3.2.16 资源管理
比如通过nice()设置CPU优先级,通过unlimit(1)限制资源等。
Linux中,**control group(cgroup)**对于云计算当中管理OS虚拟化的性能影响很重要。
3.2.17 可观察性
3.4 Linux kernel
3.4.1 内核开发
linux内核开发过程中尤其和性能相关的关键点:
| CPU scheduling classes | |
| I/O scheduling classes | |
| TCP congestion algorithms | TCP拥塞算法 |
| Overcommit | Along with the out-of-memory (OOM) killer, this is a strategy for doing more with less main memory |
| Futex (2.5.7) | fast user-space mutex, this is used to provide high-performing userlevel synchronization primitives |
| Huge pages (2.5.36) | |
| OProfile (2.5.43) | A system profiler for studying CPU usage and other events, for both the kernel and applications. |
| RCU (2.5.43) | |
| epoll (2.5.46) | |
| Modular I/O scheduling (2.6.10) | Linux provides pluggable scheduling algorithms for scheduling block device I/O |
| DebugFS (2.6.11) | |
| Cpusets (2.6.12) | exclusive CPU grouping for processes |
| Voluntary kernel preemption (2.6.13) | |
| inotify (2.6.13) | A framework for monitoring file system events |
| blktrace (2.6.17) | A framework and tool for tracing block I/O events(后来迁移到了tracepoints) |
| splice (2.6.17) | A system call to move data quickly between file descriptors and pipes, without a trip through user-space |
| Delay accounting (2.6.18) | Tracks per-task delay states |
| IO accounting (2.6.20) | Measures various storage I/O statistics per process |
| DynTicks (2.6.21) | Dynamic ticks allow the kernel timer interrupt (clock) to not fire during idle, saving CPU resources and power |
| SLUB (2.6.22) | new and simplified version of the slab memory allocator |
| CFS (2.6.23) | Completely fair scheduler |
| cgroups (2.6.24) | Control groups allow resource usage to be measured and limited for groups of processes |
| TCP LRO (2.6.24) | |
| latencytop (2.6.25) | 观察延时的工具 |
| Tracepoints (2.6.28) | |
| perf (2.6.31) | Linux Performance Events (perf) is a set of tools for performance observability, including CPU performance counter profiling and static and dynamic tracing |
| No BKL (2.6.37) | 移除了linux内核中的大内核锁 |
| KVM | The Kernel-based Virtual Machine (KVM) technology KVM allows virtual operating system instances to be created, running their own kernel |
| BPF JIT (3.0) | A Just-In-Time (JIT) compiler for the Berkeley Packet Filter (BPF) to improve packet filtering performance by compiling BPF bytecode to native instructions |
| CFS bandwidth control (3.2) | A CPU scheduling algorithm that supports CPU quotas and throttling |
| TCP anti-bufferbloat (3.3+) | 为了对抗bufferbloat问题,个人理解TCP缓存臃肿,缓冲区越来越大不是好事,转发设备就变成了存储设备,延时越来越长 |
| uprobes (3.5) | The infrastructure for dynamic tracing of user-level software, used by other tools (perf, SystemTap, etc.). |
| TCP early retransmit (3.5) | |
| TFO (3.6, 3.7, 3.13) | TCP Fast Open (TFO) can reduce the TCP three-way handshake to a single SYN packet with a TFO cookie, improving performance |
| NUMA balancing (3.8+) | |
| SO_REUSEPORT (3.9) | A socket option to allow multiple listener sockets to bind to the same port, improving multi-threaded scalability;原来这个功能linux-3.9才实现的哇 |
| SSD cache devices (3.9) | Device mapper support for an SSD device to be used as a cache for a slower rotating disk |
| bcache (3.10) | An SSD cache technology for the block interface |
| TCP TLP (3.10) | TCP Tail Loss Probe (TLP) is a scheme to avoid costly timer-based retransmits by sending new data or the last unacknowledged segment after a shorter probe timeout, to trigger faster recovery |
| NO_HZ_FULL (3.10, 3.12) | Also known as timerless multitasking or a tickless kernel, this allows non-idle threads to run without clock ticks, avoiding workload perturbations |
| Multiqueue block I/O (3.13) | This provides per-CPU I/O submission queues rather than a single request queue |
| SCHED_DEADLINE (3.14) | |
| TCP autocorking (3.14) | |
| MCS locks and qspinlocks (3.15) | Efficient kernel locks |
| Extended BPF (3.18+) | An in-kernel execution environment for running secure kernelmode programs |
| Overlayfs (3.18) | A union mount file system included in Linux. It creates virtual file systems on top of others, which can also be modified without changing the first. 容器中使用较多 |
| DCTCP (3.18) | The Data Center TCP (DCTCP) congestion control algorithm |
| DAX (4.0) | Direct Access (DAX) allows user space to read from persistent-memory storage devices directly, without buffer overheads |
| Queued spinlocks (4.2) | Offering better performance under contention |
| TCP lockless listener (4.4) | The TCP listener fast path became lockless(和TCP快转有关?) |
| cgroup v2 (4.5, 4.15) | |
| epoll scalability (4.5) | |
| KCM (4.6) | |
| TCP NV (4.8) | |
| XDP (4.8, 4.18) | eXpress Data Path (XDP) is a BPF-based programmable fast path for high-performance networking |
| TCP BBR (4.9) | Bottleneck Bandwidth and RTT (BBR) is a TCP congestion control algorithm that provides improved latency and throughput over networks suffering packet loss and bufferbloat. 谷歌提出的新型拥塞控制算法BBR |
| Hardware latency tracer (4.9) | An Ftrace tracer that can detect system latency caused by hardware and firmware, including system management interrupts (SMIs) |
| perf c2c (4.10) | The cache-to-cache (c2c) perf subcommand can help identify CPU cache performance issues, including false sharing |
| Intel CAT (4.10) | Support for Intel Cache Allocation Technology (CAT) allowing tasks to have dedicated CPU cache space. This can be used by containers to help with the noisy neighbor problem |
| Multiqueue I/O schedulers: BPQ, Kyber (4.12) | |
| Kernel TLS (4.13, 4.17) | |
| MSG_ZEROCOPY (4.14) | A send(2) flag to avoid extra copies of packet bytes between an application and the network interface |
| PCID (4.14) | Linux added support for process-context ID (PCID), a processor MMU feature to help avoid TLB flushes on context switches |
| PSI (4.20, 5.2) | Pressure stall information (PSI) is a set of new metrics to show time spent stalled on CPU, memory, or I/O; 压力阻塞信息统计 |
| TCP EDT (4.20) | The TCP stack switched to Early Departure Time (EDT) |
| Multi-queue I/O (5.0) | Multi-queue block I/O schedulers became the default in 5.0, and classic schedulers were removed. |
| UDP GRO (5.0) | UDP Generic Receive Offload (GRO) improves performance by allowing packets to be aggregated by the driver and card and passed up stack |
| io_uring (5.1) | A generic asynchronous interface for fast communication between applications and the kernel, making use of shared ring buffers. Primary uses include fast disk and network I/O |
| MADV_COLD, MADV_PAGEOUT (5.4) | These madvise(2) flags are hints to the kernel that memory is needed but not anytime soon |
| MultiPath TCP (5.6) | Multiple network links (e.g., 3G and WiFi) can be used to improve the performance and reliability of a single TCP connection |
| Boot-time tracing (5.6) | Allows Ftrace to trace the early boot process |
| Thermal pressure (5.7) | The scheduler accounts for thermal throttling to make better placement decisions. 这个是什么特性?和调度器性能有关 |
| perf flame graphs (5.8) | perf火焰图 |
Linux中和性能较为相关的主题介绍:systemd,KPTI,extended BPF。
3.4.2 systemd
systemd包含的两个重要功能:
- 包含依赖关系感知的服务启动
- 服务时间统计
性能相关的一个方向就是系统启动时间,systemd可以显示哪里可以调教启动时间
root@ubuntu:~# systemd-analyze
Startup finished in 7.197s (kernel) + 1min 32.950s (userspace) = 1min 40.147s
graphical.target reached after 19.606s in userspace
root@ubuntu:~#
root@ubuntu:~# systemd-analyze critical-chain
The time when unit became active or started is printed after the "@" character.
The time the unit took to start is printed after the "+" character.

graphical.target @19.606s
└─multi-user.target @19.606s
  └─kerneloops.service @19.567s +39ms
    └─network-online.target @19.552s
      └─vmware-tools.service @10.629s +8.922s
        └─basic.target @10.414s
          └─sockets.target @10.414s
            └─snapd.socket @10.412s +1ms
              └─sysinit.target @10.349s
                └─snapd.apparmor.service @10.007s +341ms
                  └─apparmor.service @9.259s +747ms
                    └─local-fs.target @9.258s
                      └─run-user-1000-gvfs.mount @45.084s
                        └─run-user-1000.mount @44.854s
                          └─local-fs-pre.target @3.865s
                            └─systemd-tmpfiles-setup-dev.service @3.625s +239ms
                              └─systemd-sysusers.service @3.286s +338ms
                                └─systemd-remount-fs.service @3.174s +53ms
                                  └─systemd-journald.socket @2.945s
                                    └─system.slice @2.937s
                                      └─-.slice @2.937s
# 可以看出vmware-tools.server花费了8.922s,时间最长

 # blame子命令中显示了启动时间的由长到短的排序
root@ubuntu:~# systemd-analyze blame
54.409s apt-daily.service
30.781s fwupd-refresh.service
 8.922s vmware-tools.service
 8.457s networkd-dispatcher.service
 8.066s snapd.service
 7.526s man-db.service
 5.914s dev-sda5.device
 5.505s udisks2.service
 5.248s NetworkManager.service
 5.047s accounts-daemon.service
 4.869s polkit.service
 3.258s dev-loop8.device
 3.234s avahi-daemon.service
 3.216s dev-loop9.device
 3.177s dev-loop2.device
 3.130s switcheroo-control.service
 ...
systemd-analyze plot > xxx.svg可以生成生成启动的时间详细图表
3.4.3 KPTI
KPTI(Kernel PageTable Isolation)全称内核页表隔离。KPTI是由KAISER补丁修改而来。之前,进程地址空间被分成了内核地址空间和用户地址空间。其中内核地址空间映射到了整个物理地址空间,而用户地址空间只能映射到指定的物理地址空间。内核地址空间和用户地址空间共用一个页全局目录表(PGD表示进程的整个地址空间) 。meltdown漏洞就恰恰利用了这一点。攻击者在非法访问内核地址和CPU处理异常的时间窗口,通过访存微指令获取内核数据。为了彻底防止用户程序获取内核数据,可以令内核地址空间和用户地址空间使用两组页表集(也就是使用两个PGD)。
KPTI对性能有很大影响。在上下文切换中带来TLB冲刷,影响性能。linux后来引进了PCID,在某些场景下可以避免TLB冲刷。
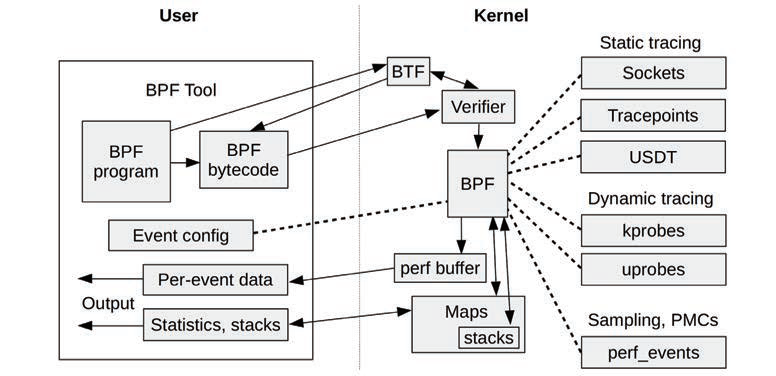
3.4.5 extended BPF
BPF程序运行在内核态。
BPF bytecode must first pass through a verifier that checks for safety, ensuring that the BPF program will not crash or corrupt the kernel. It may also use a BPF Type Format (BTF) system for understanding data types and structures. BPF programs can output data via a perf ring buffer, an efficient way to emit per-event data, or via maps, which are suited for statistics.

为开发者提供学习成长、分享交流、生态实践、资源工具等服务,帮助开发者快速成长。
更多推荐


 4
4 1
1- 0


 已为社区贡献5条内容

所有评论(0)