pheatmap 参数详解
提示:文章写完后,目录可以自动生成,如何生成可参考右边的帮助文档文章目录前言一、参数解析二、参考例子1.基础热图前言A function to draw clustered heatmaps where one has better control over some graphical parameters such as cell size, etc.pheatmap 这个包可以认为是heat
·
提示:文章写完后,目录可以自动生成,如何生成可参考右边的帮助文档
前言
A function to draw clustered heatmaps where one has better control over some graphical parameters such as cell size, etc.
pheatmap 这个包可以认为是heatmap的加强版,基本可以一包走天下了。
一、参数解析
Usage
pheatmap(mat, color = colorRampPalette(rev(brewer.pal(n = 7, name =
  "RdYlBu")))(100), kmeans_k = NA, breaks = NA, border_color = "grey60",
  cellwidth = NA, cellheight = NA, scale = "none", cluster_rows = TRUE,
  cluster_cols = TRUE, clustering_distance_rows = "euclidean",
  clustering_distance_cols = "euclidean", clustering_method = "complete",
  clustering_callback = identity2, cutree_rows = NA, cutree_cols = NA,
  treeheight_row = ifelse((class(cluster_rows) == "hclust") || cluster_rows,
  50, 0), treeheight_col = ifelse((class(cluster_cols) == "hclust") ||
  cluster_cols, 50, 0), legend = TRUE, legend_breaks = NA,
  legend_labels = NA, annotation_row = NA, annotation_col = NA,
  annotation = NA, annotation_colors = NA, annotation_legend = TRUE,
  annotation_names_row = TRUE, annotation_names_col = TRUE,
  drop_levels = TRUE, show_rownames = T, show_colnames = T, main = NA,
  fontsize = 10, fontsize_row = fontsize, fontsize_col = fontsize,
  angle_col = c("270", "0", "45", "90", "315"), display_numbers = F,
  number_format = "%.2f", number_color = "grey30", fontsize_number = 0.8
  * fontsize, gaps_row = NULL, gaps_col = NULL, labels_row = NULL,
  labels_col = NULL, filename = NA, width = NA, height = NA,
  silent = FALSE, na_col = "#DDDDDD", ...)
看着有点头大,下面直接看例子。
二、参考例子
1.基础热图
Test 数据集:
test = matrix(rnorm(200), 20, 10)
test[1:10, seq(1, 10, 2)] = test[1:10, seq(1, 10, 2)] + 3
test[11:20, seq(2, 10, 2)] = test[11:20, seq(2, 10, 2)] + 2
test[15:20, seq(2, 10, 2)] = test[15:20, seq(2, 10, 2)] + 4
colnames(test) = paste("Test", 1:10, sep = "")
rownames(test) = paste("Gene", 1:20, sep = "")

colname 是sample 的名字,rowname 是gene 的名字。
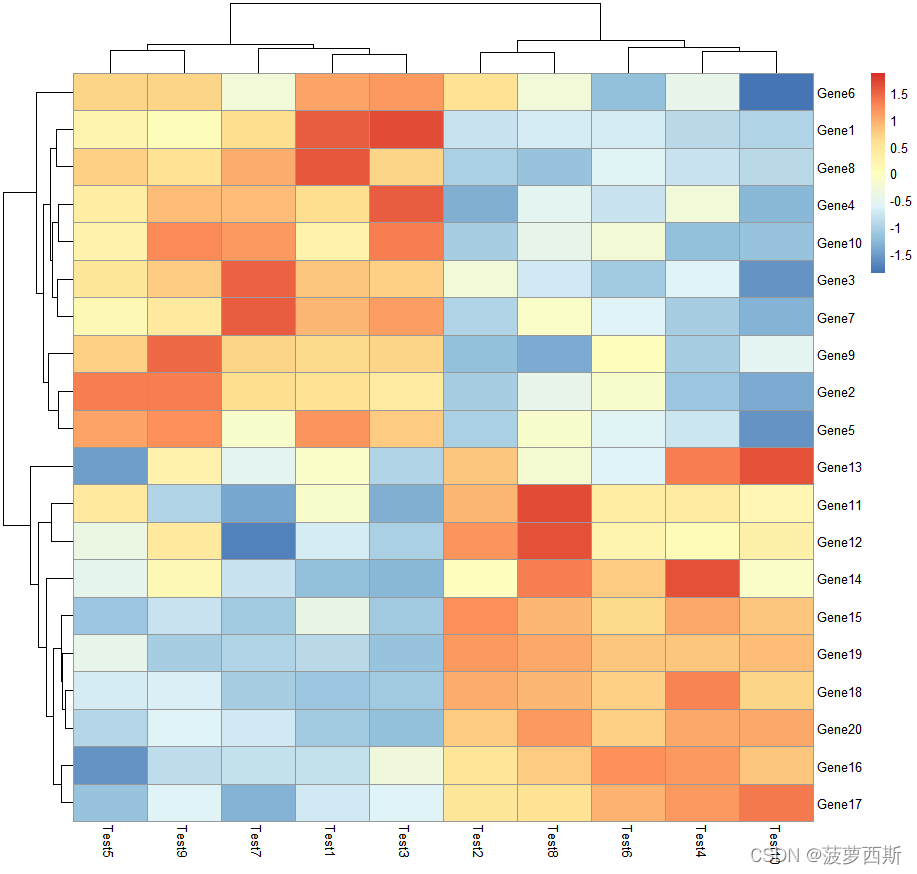
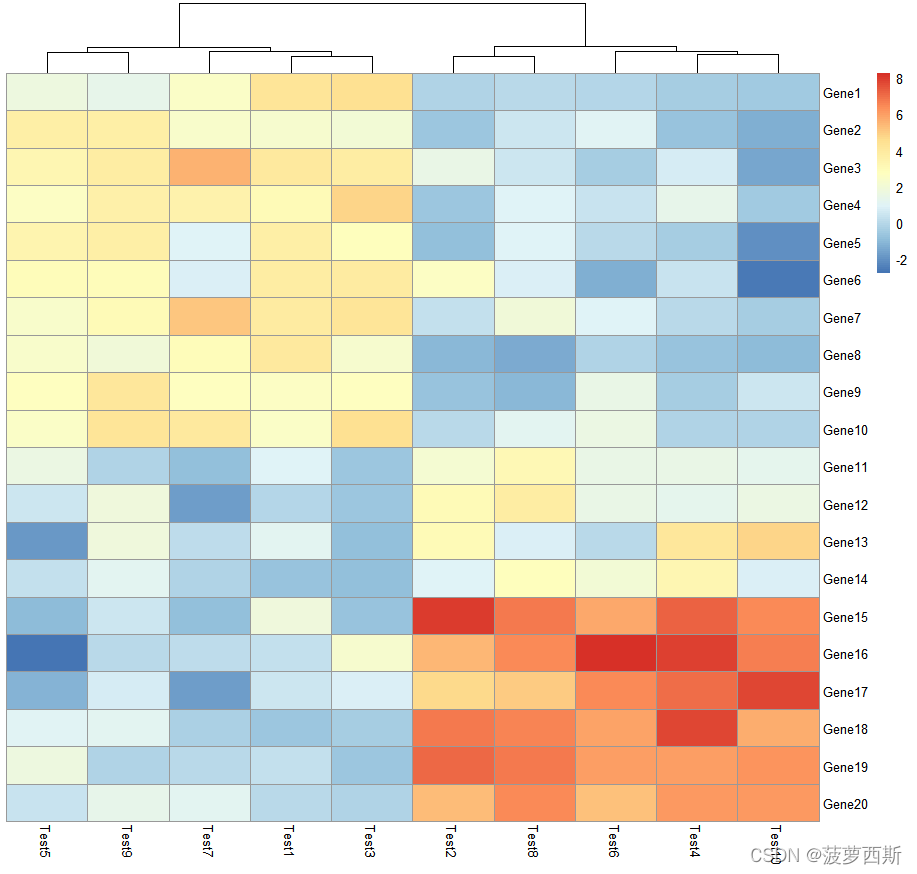
# Draw heatmaps 基础热图 直观感受一下
pheatmap(test)

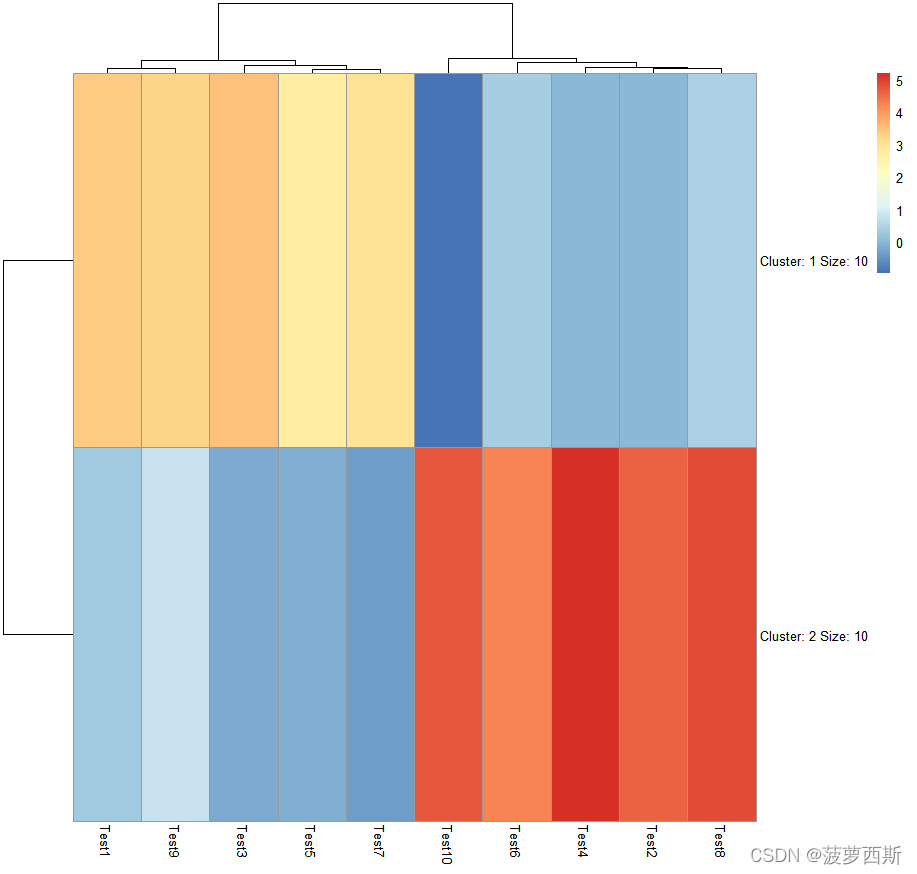
pheatmap(test, kmeans_k = 2) # 用kmean_k 把列的特征聚类,2 即是聚成2列。
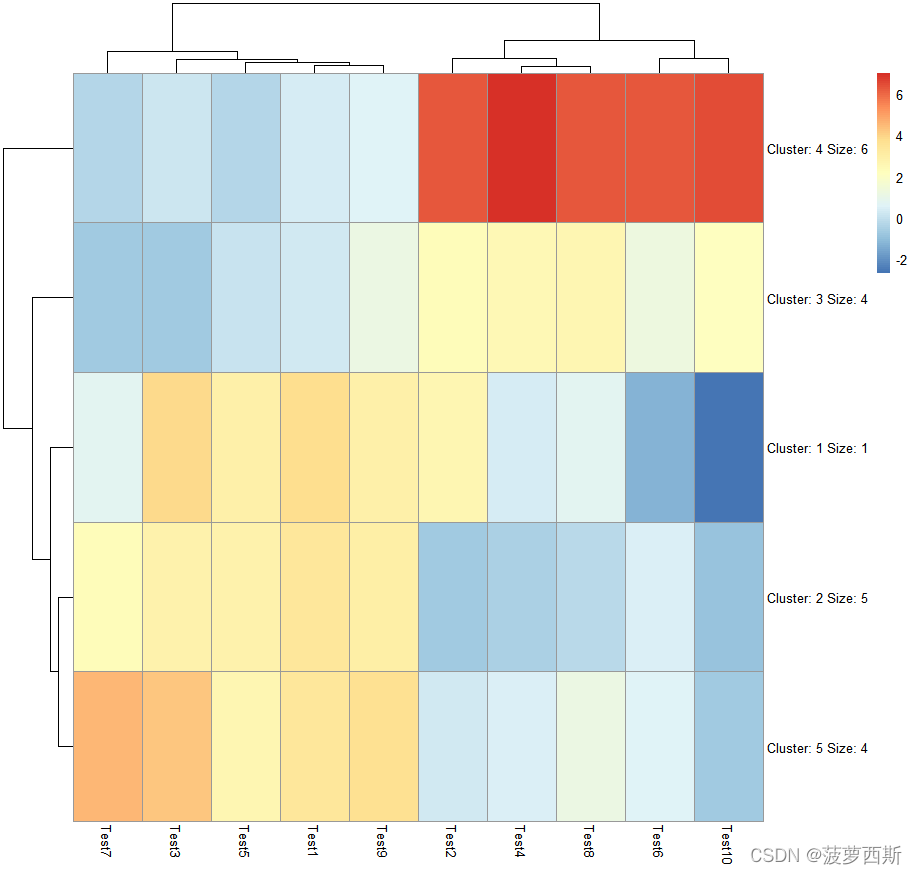
pheatmap(test, kmeans_k = 5)
#scale
#character indicating if the values should be centered and scaled in either the row direction or the column direction, or none. Corresponding values are "row", "column" and "none"
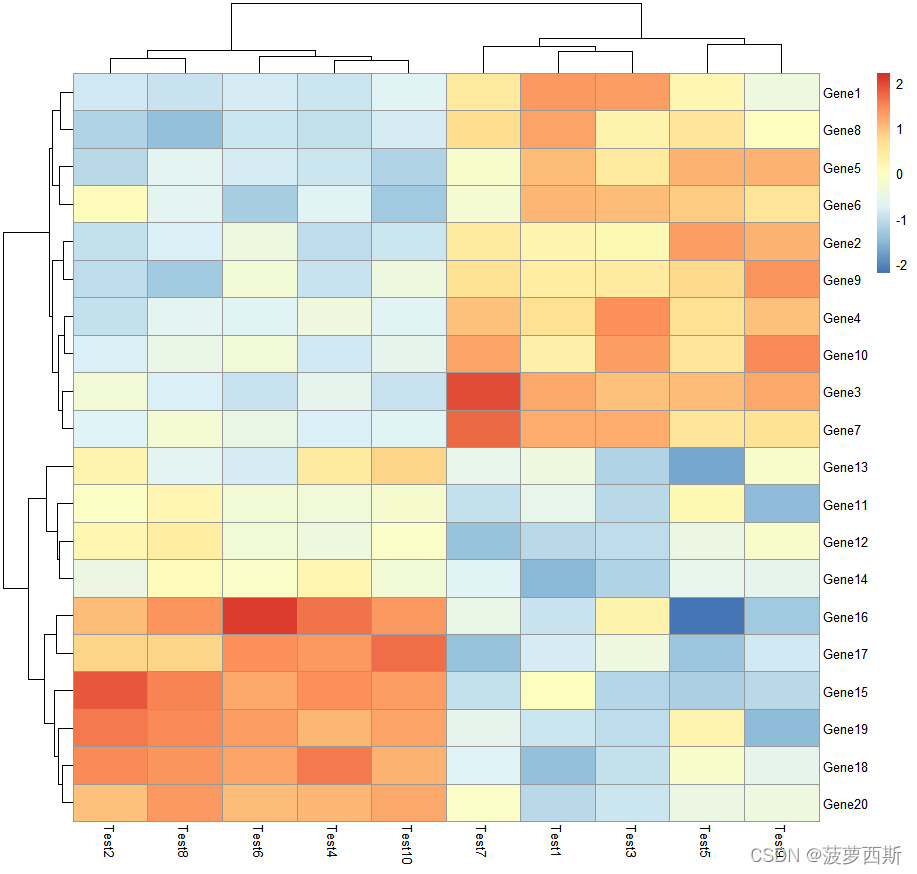
pheatmap(test, scale = "row")
pheatmap(test, scale = "column")
#clustering_distance_rows
#distance measure used in clustering rows. Possible values are "correlation" for Pearson correlation and all the distances supported by dist, such as "euclidean", etc. If the value is none of the above it is assumed that a distance matrix is provided.
pheatmap(test, scale = "row", clustering_distance_rows = "correlation")

# 换个颜色
pheatmap(test, color = colorRampPalette(c("navy", "white", "firebrick3"))(50))

# 取消列聚类
pheatmap(test, cluster_row = FALSE)
#把标签和聚类 统统去掉
pheatmap(test, cluster_row = FALSE,cluster_cols = FALSE)

#把数值填进去
pheatmap(test, display_numbers = TRUE)

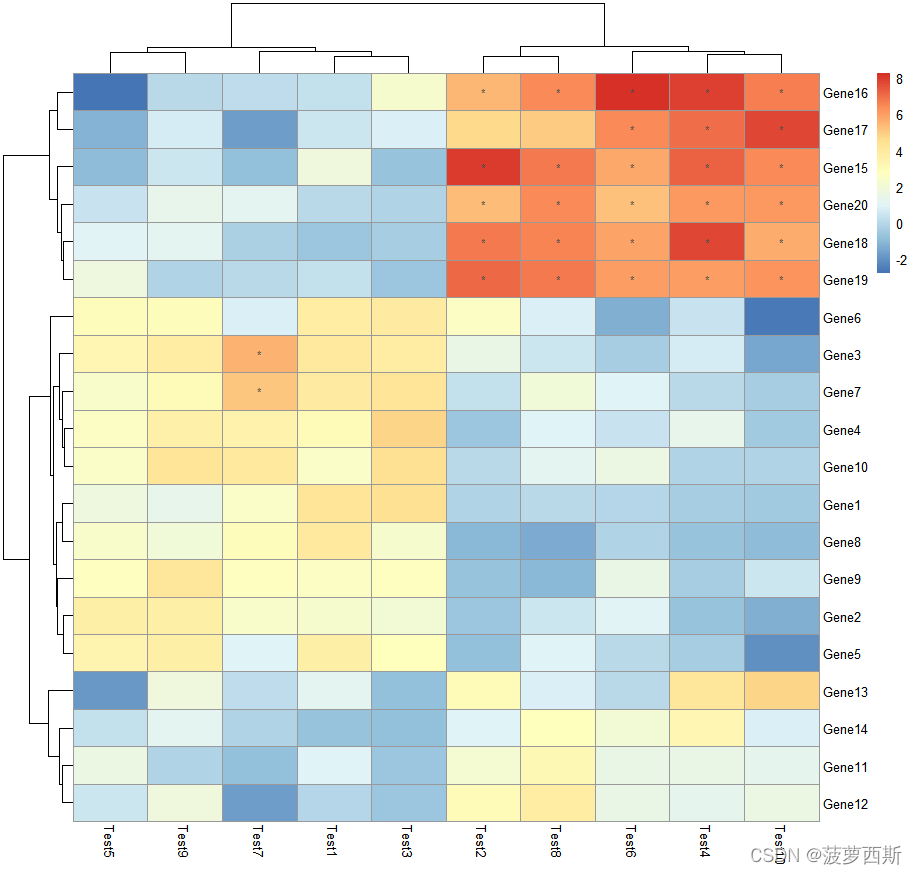
# 用*代替大于5的值
pheatmap(test, display_numbers = matrix(ifelse(test > 5, "*", ""), nrow(test)))
# Fix cell sizes and save to file with correct size 图的大小与保存
pheatmap(test, cellwidth = 15, cellheight = 12, main = "Example heatmap")
pheatmap(test, cellwidth = 15, cellheight = 12, fontsize = 8, filename = "test.pdf")
重点来了,画出行与列的annotation
annotation_col = data.frame(
  CellType = factor(rep(c("CT1", "CT2"), 5)),
  Time = 1:5
)
rownames(annotation_col) = paste("Test", 1:10, sep = "")

annotation_row = data.frame(
  GeneClass = factor(rep(c("Path1", "Path2", "Path3"), c(10, 4, 6)))
)
rownames(annotation_row) = paste("Gene", 1:20, sep = "")

col 信息 有两种

row 信息 只有一条。
# Display row and color annotations
pheatmap(test, annotation_col = annotation_col)
pheatmap(test, annotation_col = annotation_col, annotation_legend = FALSE)
pheatmap(test, annotation_col = annotation_col, annotation_row = annotation_row

# Specify colors
ann_colors = list(
Time = c("white", "firebrick"),
CellType = c(CT1 = "#1B9E77", CT2 = "#D95F02"),
GeneClass = c(Path1 = "#7570B3", Path2 = "#E7298A", Path3 = "#66A61E")
)
pheatmap(test, annotation_col = annotation_col, annotation_colors = ann_colors, main = "Title")
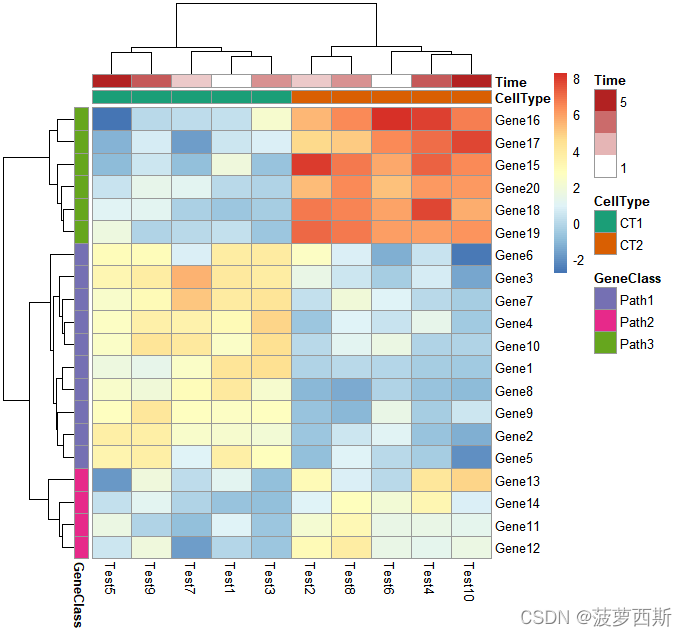
pheatmap(test, annotation_col = annotation_col, annotation_row = annotation_row,
annotation_colors = ann_colors)
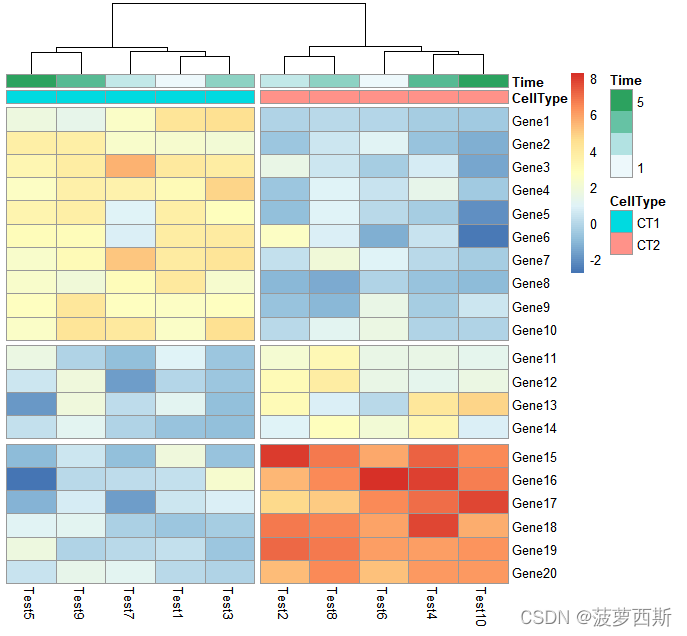
# Gaps in heatmaps
pheatmap(test, annotation_col = annotation_col, cluster_rows = FALSE, gaps_row = c(10, 14))

pheatmap(test, annotation_col = annotation_col, cluster_rows = FALSE, gaps_row = c(10, 14),
         cutree_col = 2)
# Show custom strings as row/col names
labels_row = c("", "", "", "", "", "", "", "", "", "", "", "", "", "", "",
               "", "", "Il10", "Il15", "Il1b")

pheatmap(test, annotation_col = annotation_col, labels_row = labels_row)


为开发者提供学习成长、分享交流、生态实践、资源工具等服务,帮助开发者快速成长。
更多推荐


 8
8 0
0- 0


 已为社区贡献1条内容

所有评论(0)